
Introduction
Sergei Mikhailovich Prokudin-Gorskii (1863-1944) was a visionary far ahead of his time. As early as 1907, he was convinced that color photography was the future, earning special permission from the Tsar to travel throughout the Russian Empire and capture it in color—resulting in the only color portrait of Leo Tolstoy. Prokudin-Gorskii photographed everything: people, architecture, landscapes, railways, bridges—thousands of images. His method involved recording three exposures of each scene on a glass plate using red, green, and blue filters. Even though color printing wasn't yet possible, he dreamed of "multimedia" classrooms across Russia, where students could learn about their vast country through projected color images. Unfortunately, his vision never came to fruition, as he left Russia in 1918, after the revolution, never to return. Fortunately, his RGB glass plate negatives, capturing the final years of the Russian Empire, survived and were acquired by the Library of Congress in 1948. Recently, the Library digitized these negatives and made them available online.
Methodology
Naive Search
I initally implemented a naive search algorithm that exhaustively searched over a window of possible displacements among the red and green frames to place ontop of the blue frame. The search algorithm calculated the loss function between two frames among a [-15, 15] pixel search range (as recommended by the project spec).
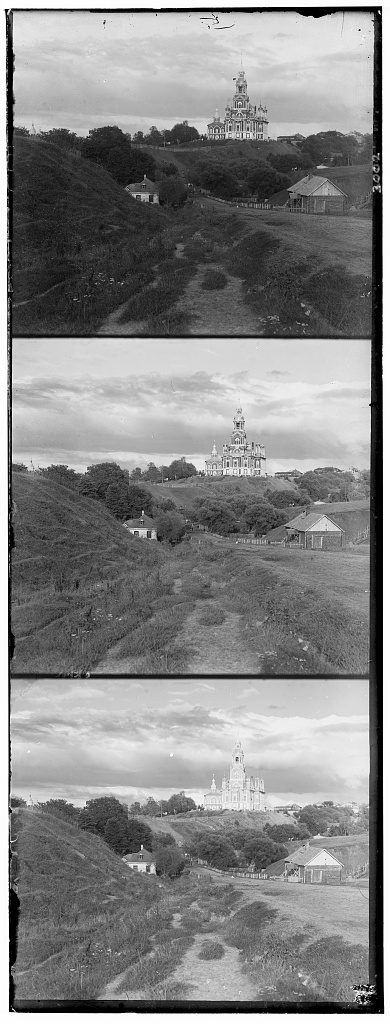
On the right, you can see the original images from the Prokudin-Gorskii Collection. I split the image up into three components corresponding and attempted to use the following two loss functions to align the frames. I also implemented a 10% border crop to get rid of the borders and optimize the alignment. Below are the two loss functions I used and the resulting output
L2 Loss (Mean Squared Error):
$$L2\_Loss(\vec{y}, \hat{\vec{y}}) = \frac{1}{N} \sum_{i=1}^{N} (\vec{y}_i - \hat{\vec{y}}_i)^2$$
Green shift: (1, -1) Red shift: (7, -1)
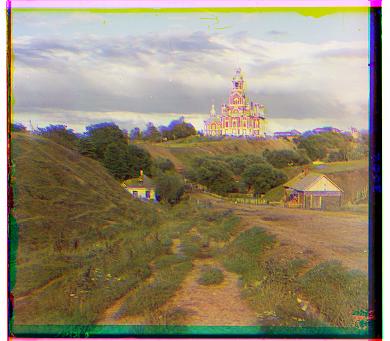
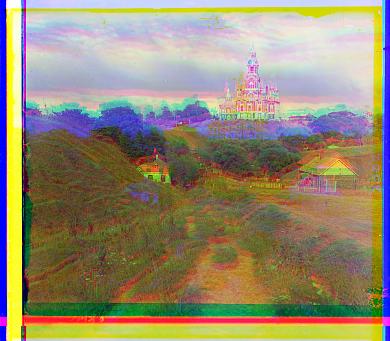
NCC (Normalized Cross Correlation):
$$NCC(\vec{x}, \vec{y}) = \langle\frac{\vec{x}}{||\vec{x}||}, \frac{\vec{y}}{||\vec{y}||}\rangle$$
Green shift: (-15, 14) Red shift: (-15, 13)
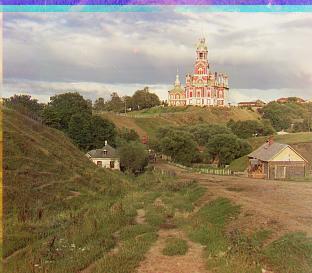
I also tried to crop the border and normalize the image for better alignment. I implemented a 10% border crop so that the loss would more accurately detect the image itself and normalized the input values in the shift calculation. This was the result:
Green shift: (5, 2) Red shift: (12, 3)
Green shift: (-3, 2) Red shift: (3, 2)
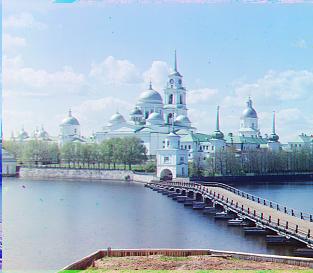
Green shift: (3, 3) Red shift: (6, 3)
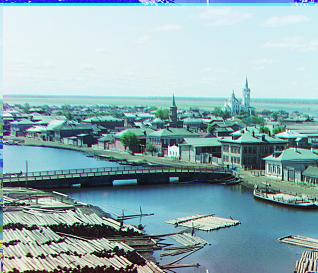
But how about higher resolution images? Can we find a solution with a better runtime?
Pyramid Search
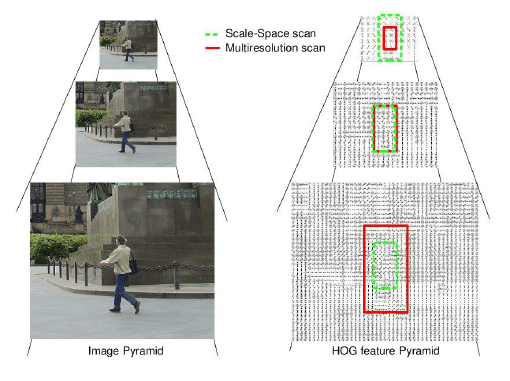
The exhaustive search worked well on images of around 400 pixels by 400 pixels (which was the smaller jpg files). However, since many of the images are of a much higher resolution including thousands of pixels. This was the case for all the .tif file formats. Since the search space had become too large, looking through all 15x15 search spaces led to lengthy computation time. To combat this, I decided to use an image pyramid.
By downscaling a high-resolution image to a lower resolution, the search space is significantly reduced, increasing computational efficiency. Building on this idea, my algorithm recursively halves the image size and conducts a basic search then scales the image back to its original resolution through recursive steps, refining the search with a smaller range at each level to maintain efficiency. This method enables the algorithm to fine-tune the displacement vector at each stage, avoiding an exhaustive search at the highest resolution.
Bells & Whistles
Edge detection
To improve my outputs, I tried implementing automatic edge detection as well as a sobel edge detection loss function.
In order to do this, two 3x3 convolutional filters are used to estimate the gradients (derivatives) of the change in pixel intensities. Edges in a image are areas where this change is significant, such as the boundary between two distinct regions (e.g., a sharp transition from a dark area to a bright area). Sobel edge detection uses two 3x3 convolutional kernels (filters) to estimate these gradients that finds the changes in the horizontal (X) and vertical (Y) directions.
$$X = \begin{bmatrix} 1 & 0 & -1\\ 2 & 0 & -2\\ 1 & 0 & -1 \end{bmatrix}\ \ \ \ \ Y = \begin{bmatrix} 1 & 2 & 1\\ 0 & 0 & 0\\ -1 & -2 & -1 \end{bmatrix}$$
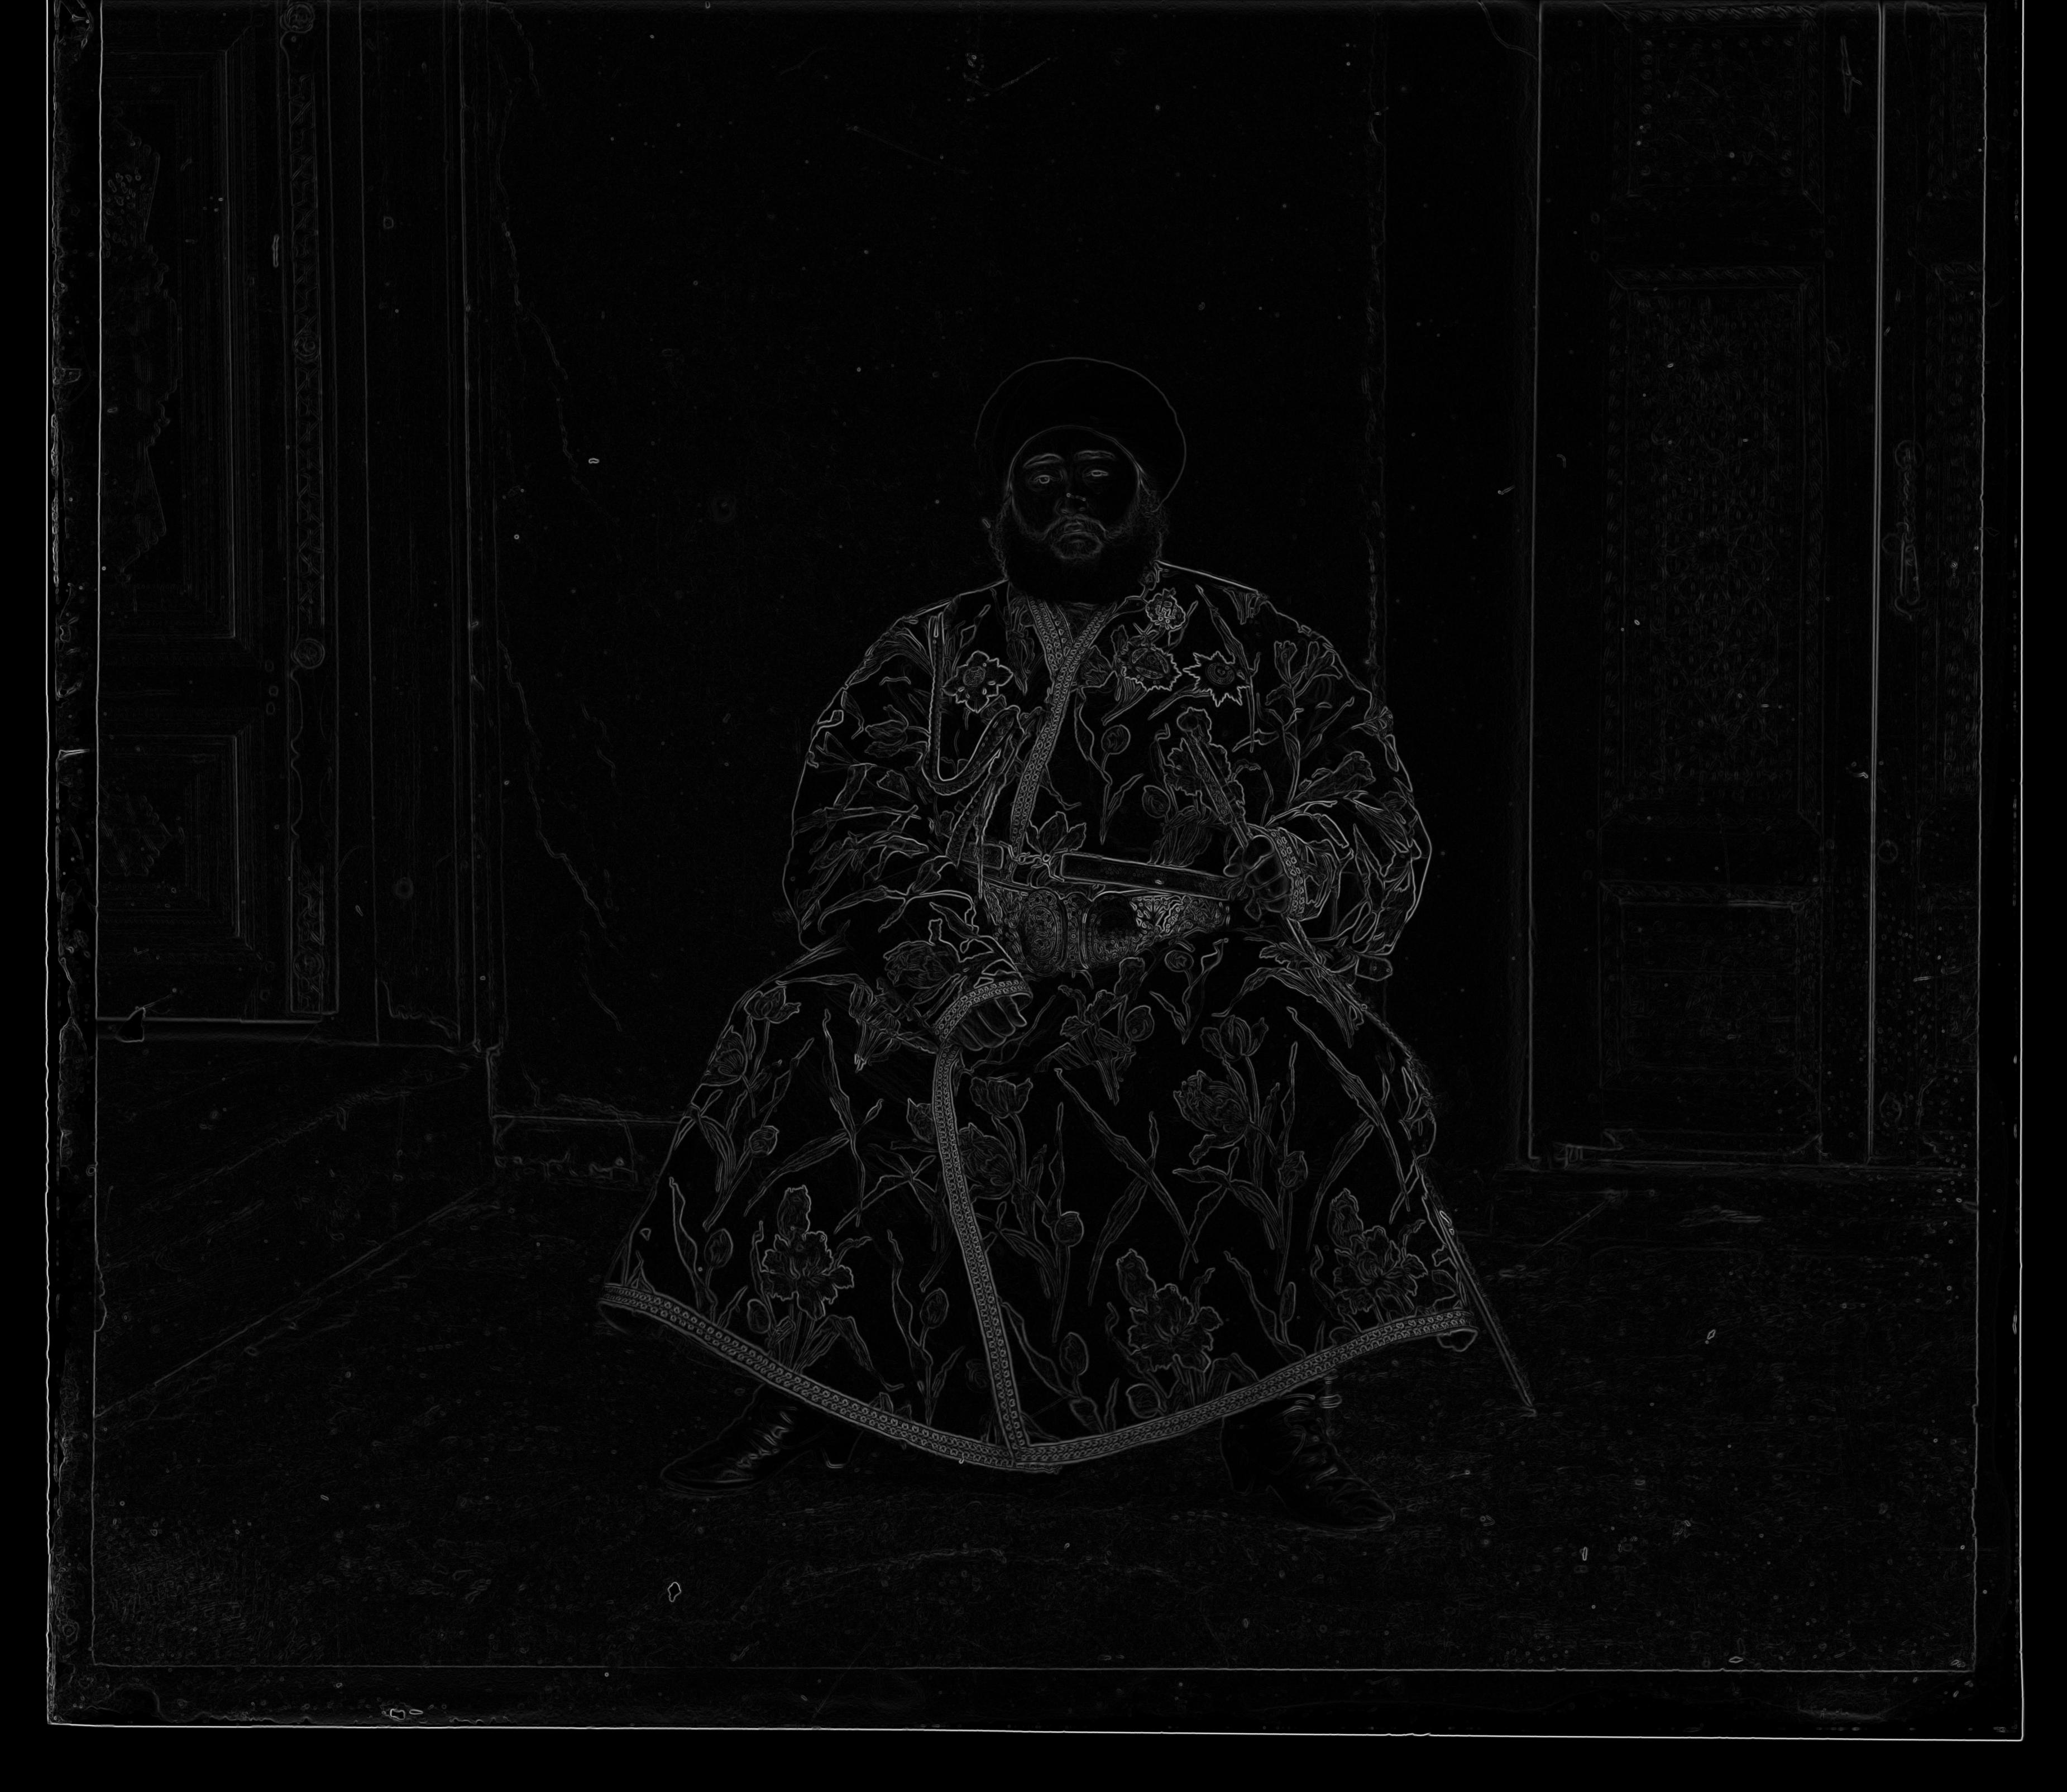
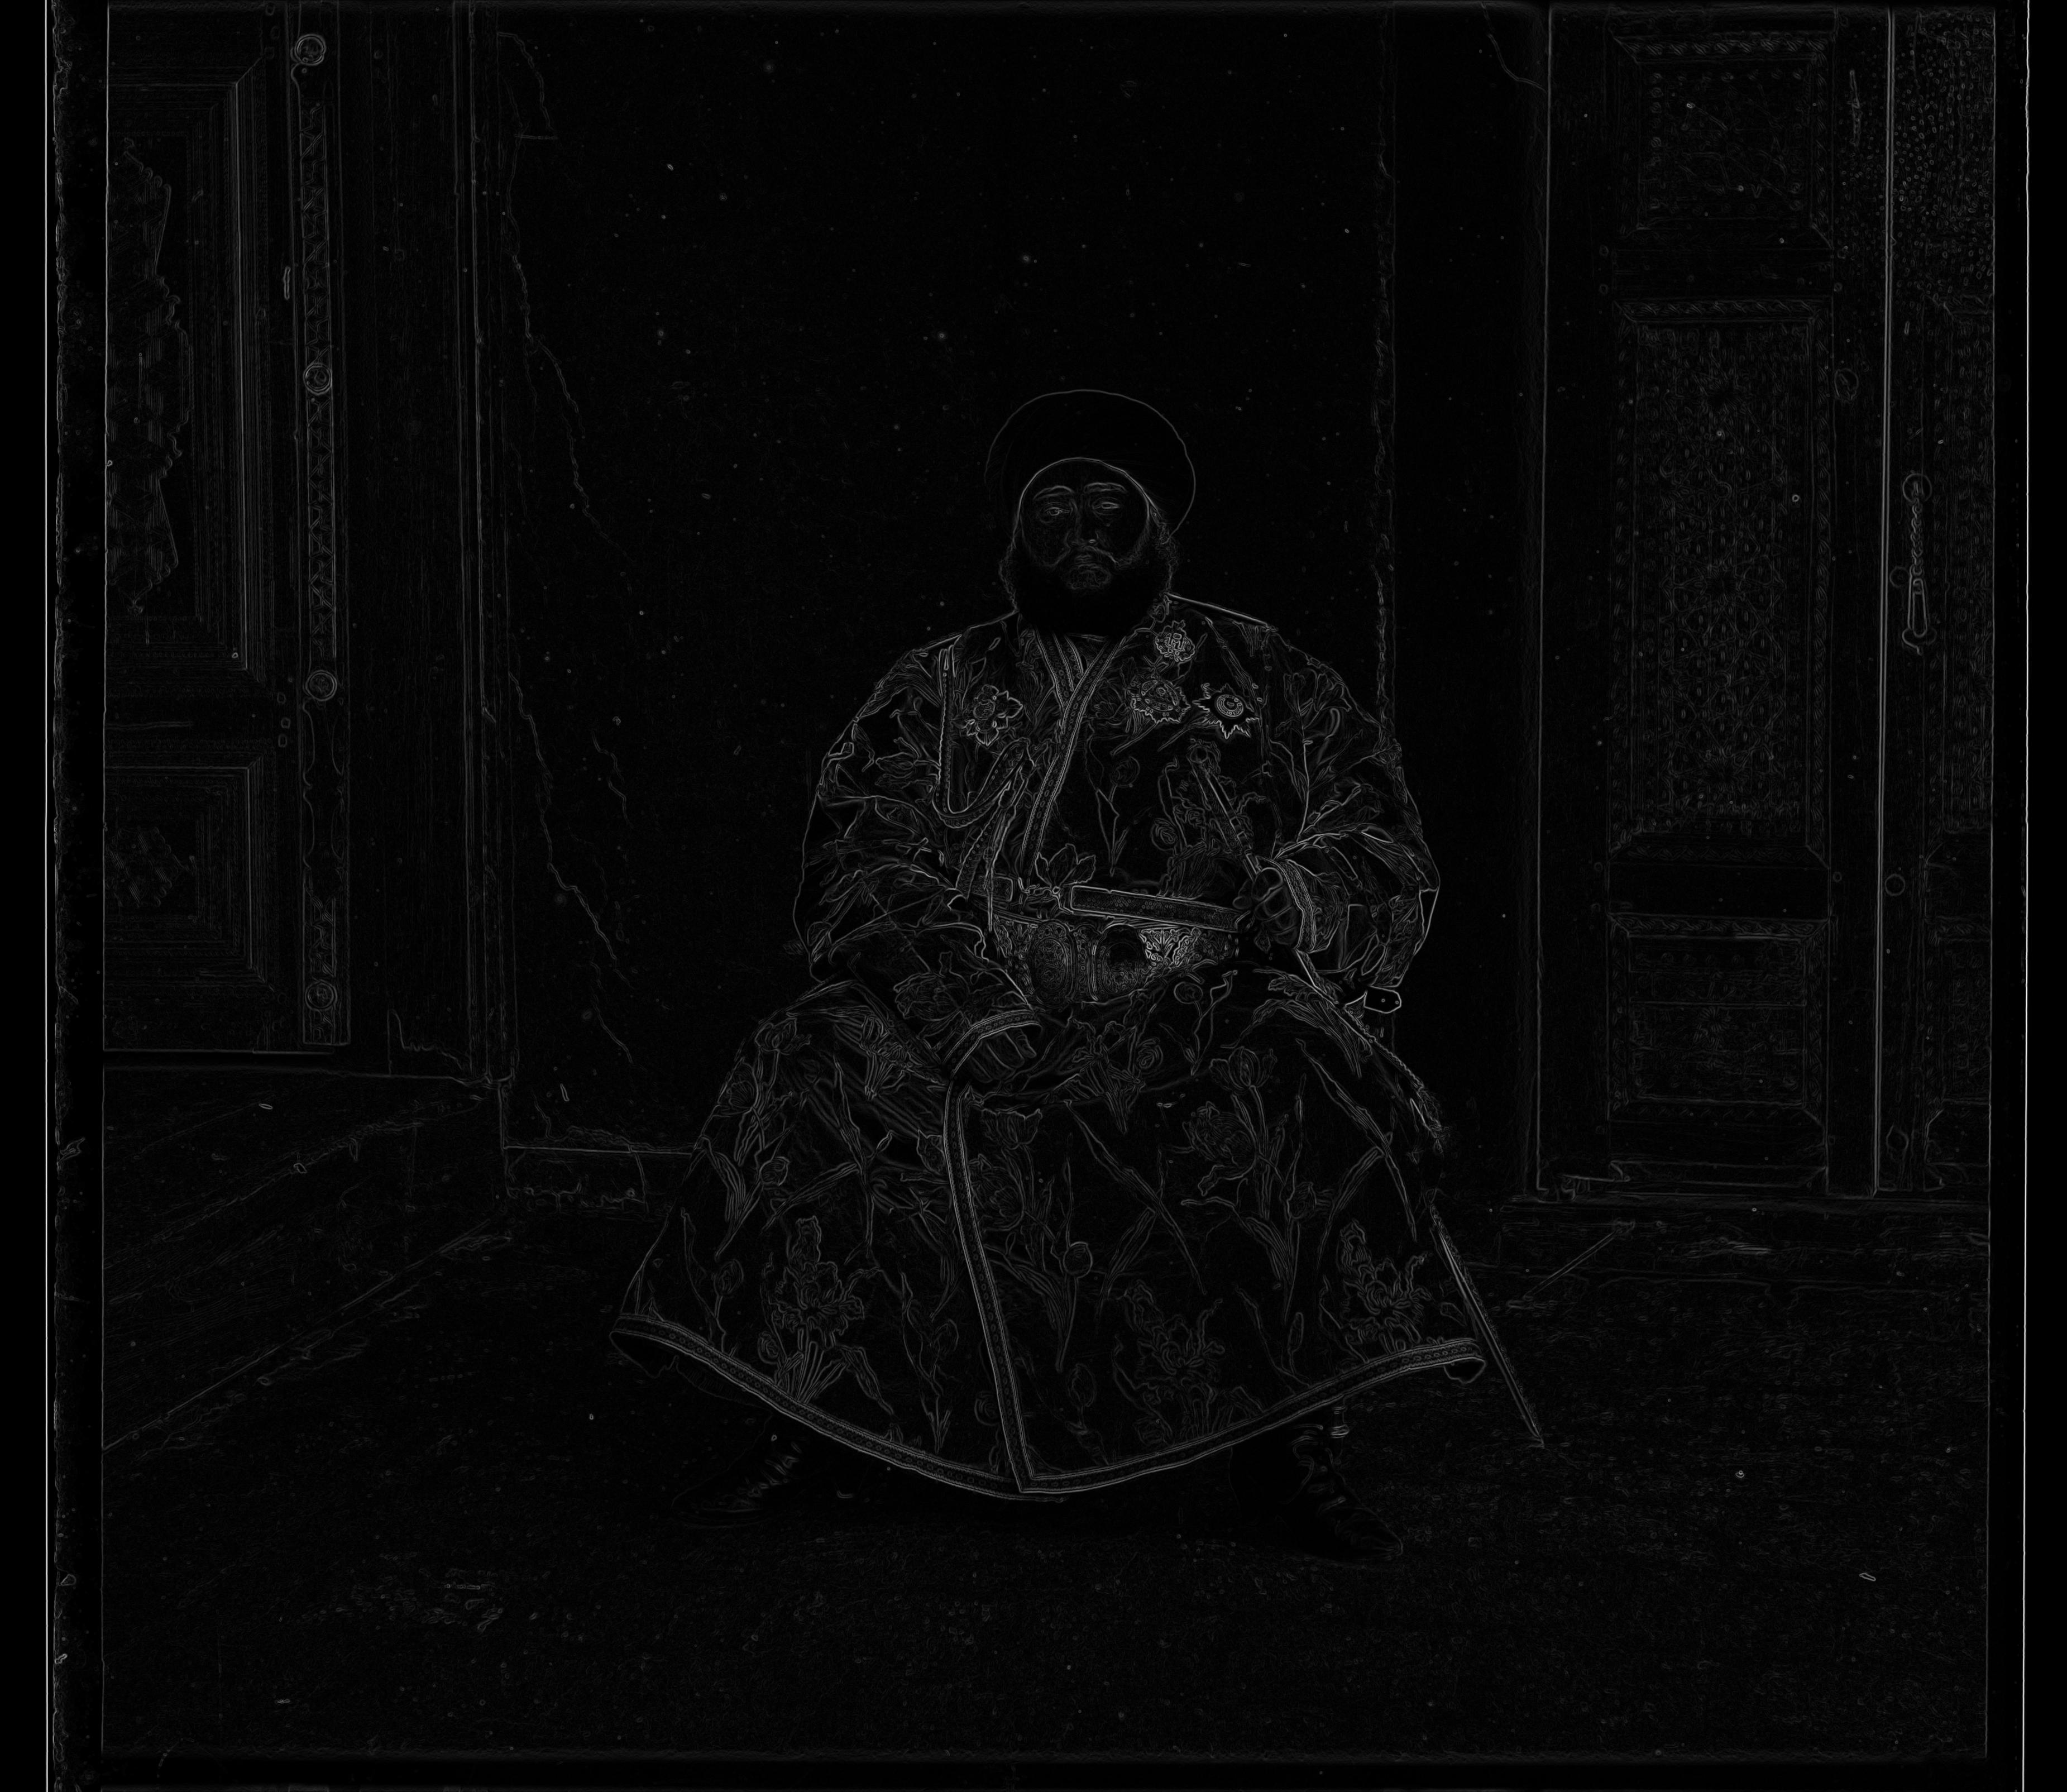
This is what the red, green and blue edges look like for Emir:
Red Channel
Green Channel
Blue Channel
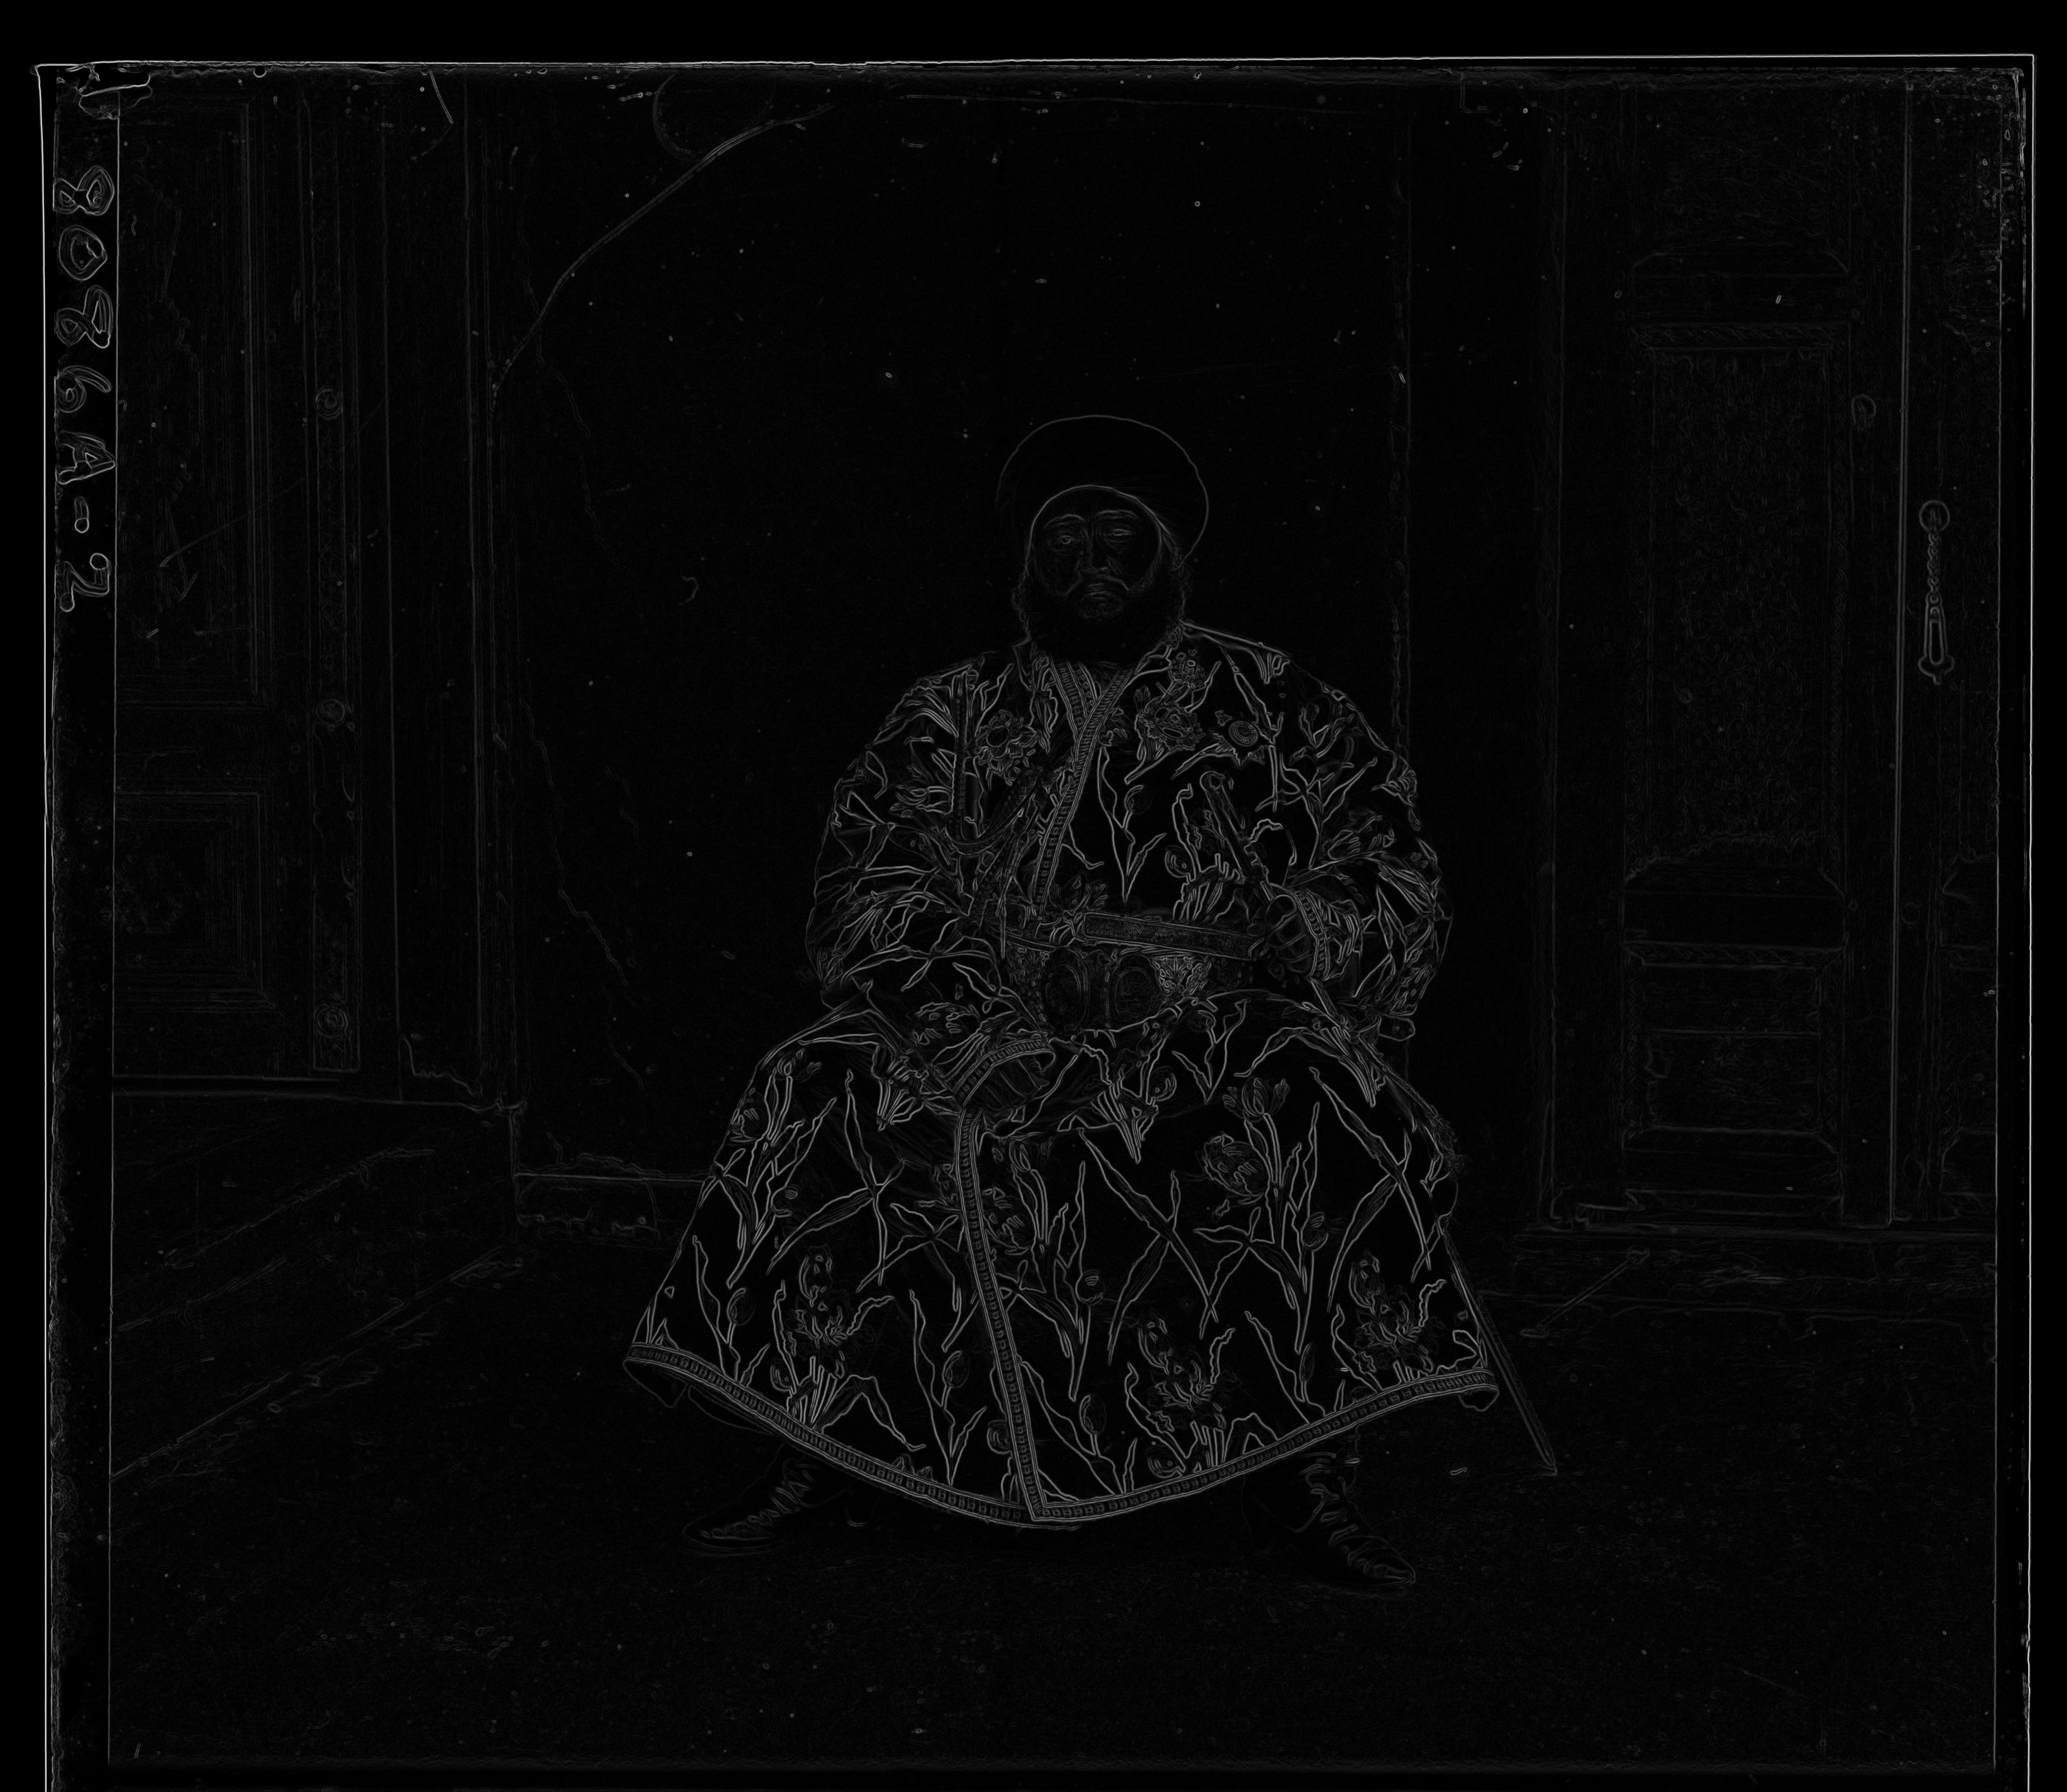
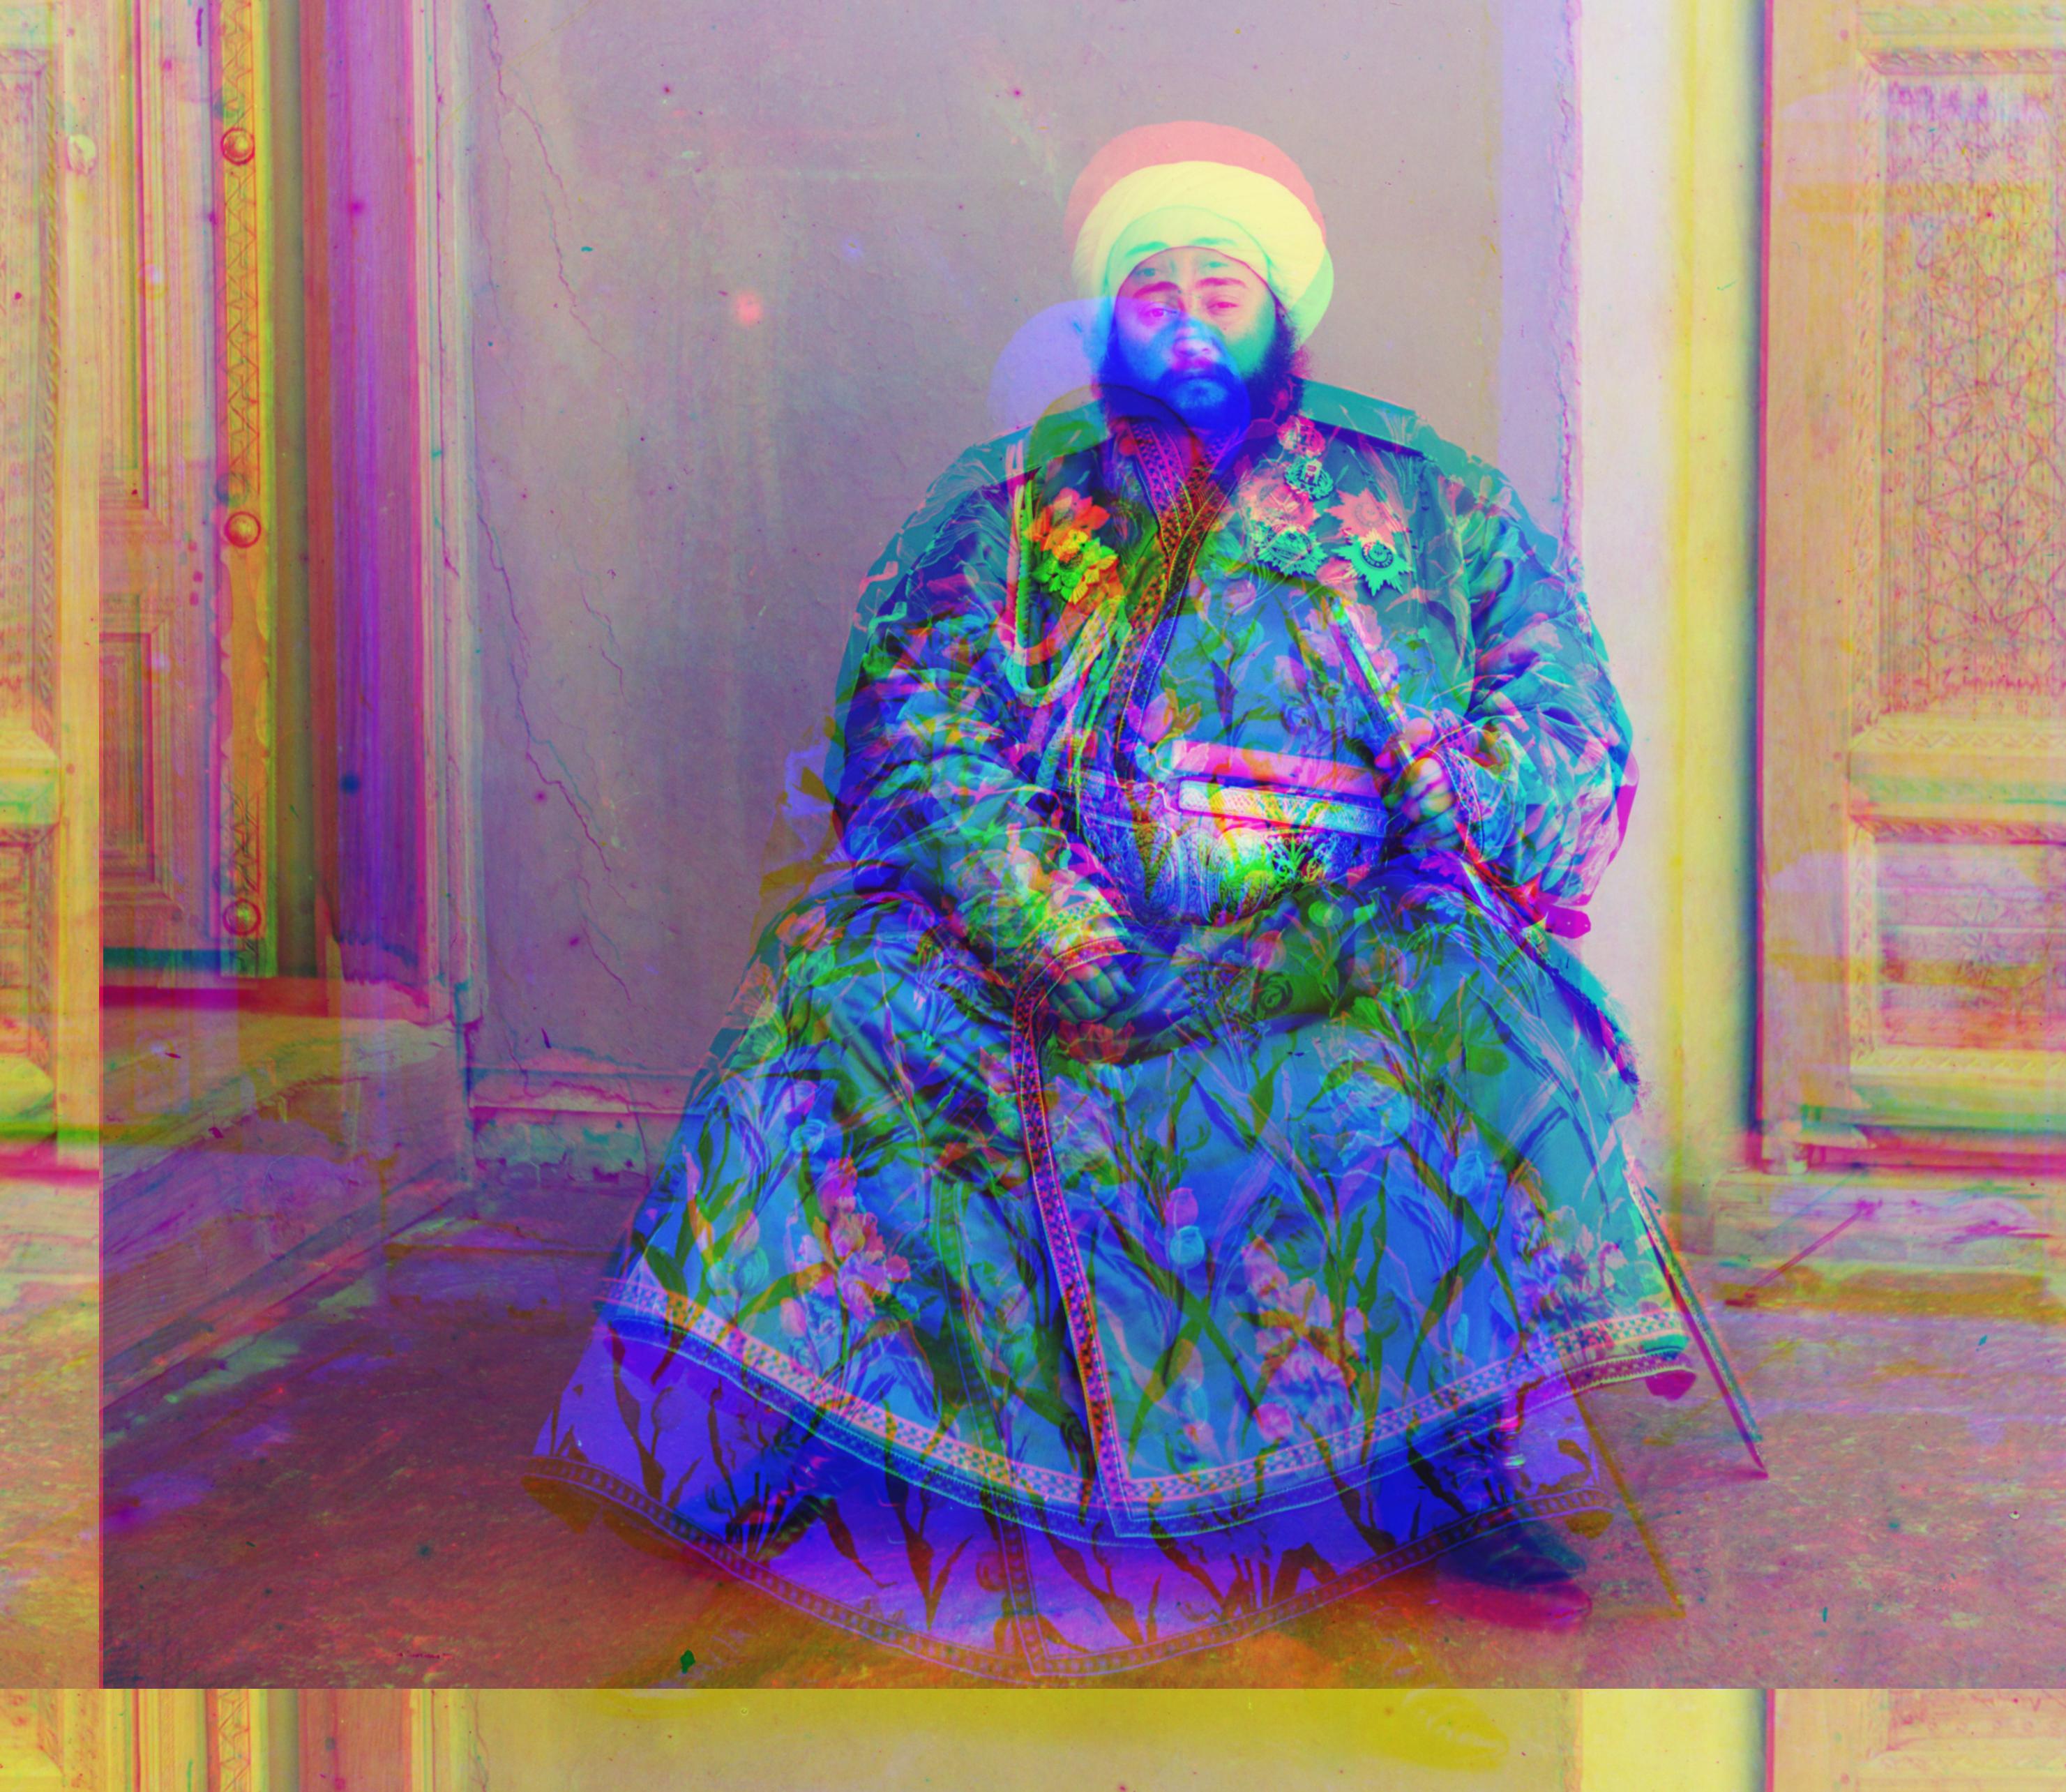
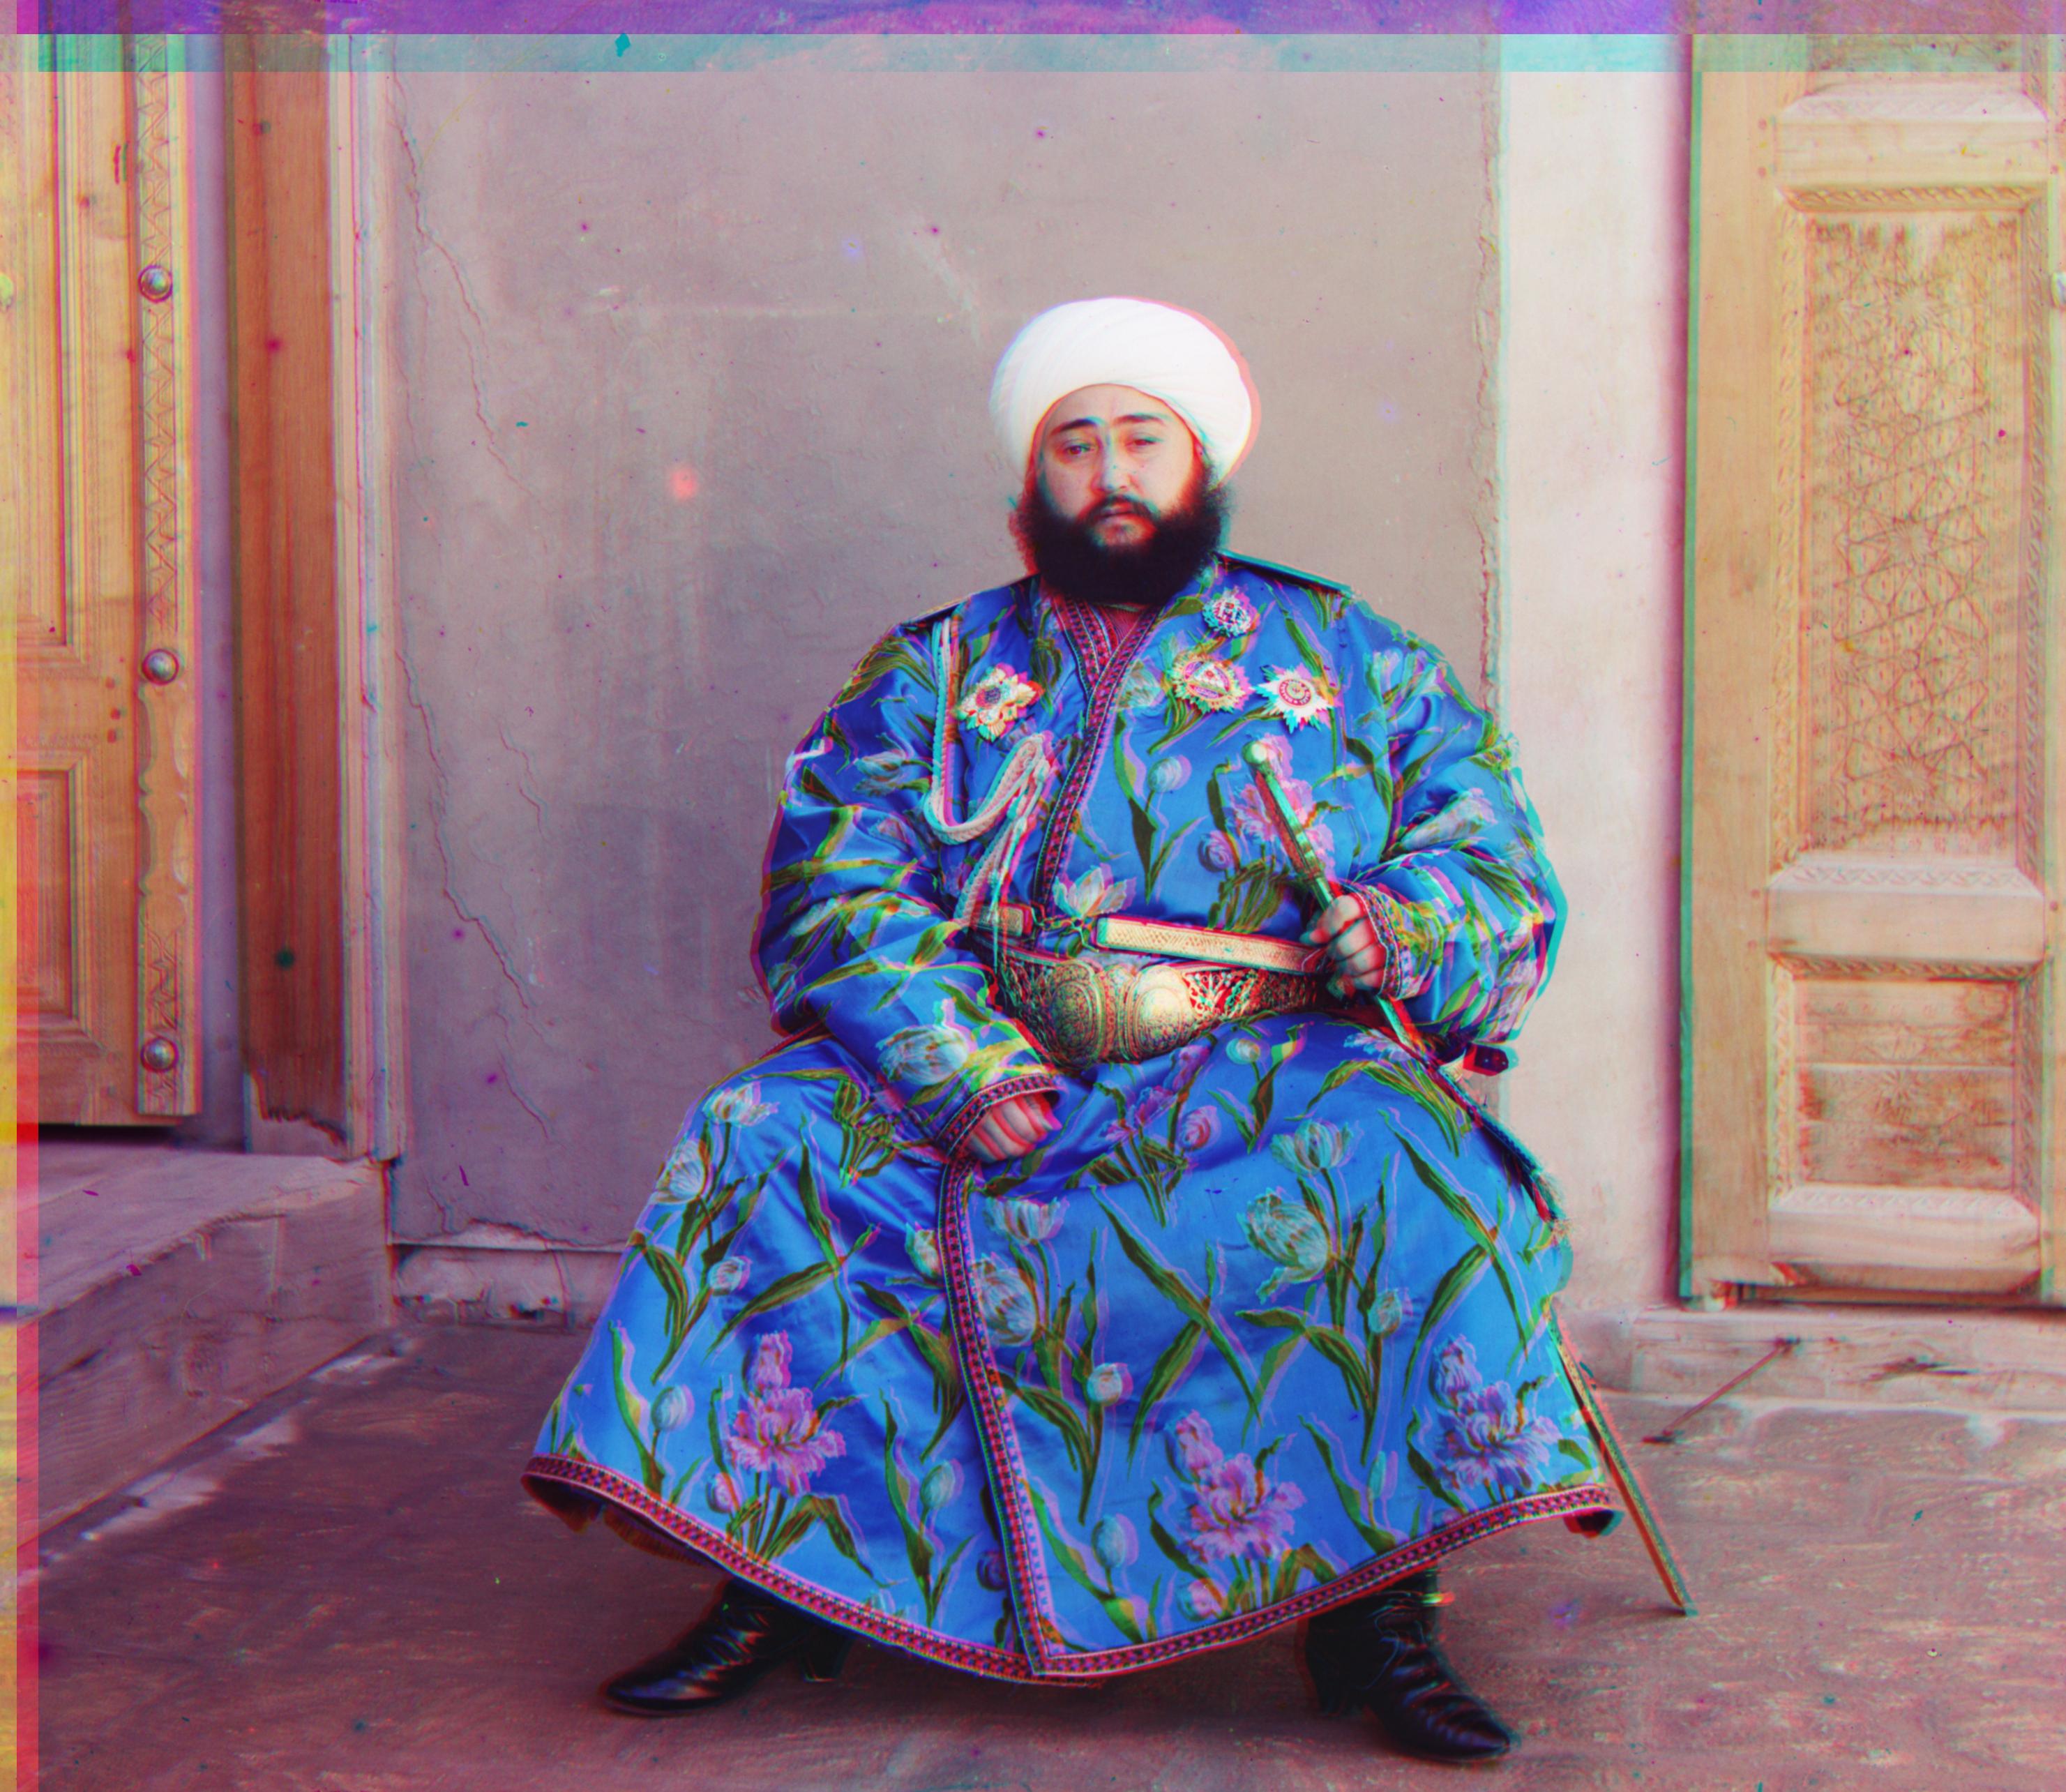
Using the sobel edge detection, I was able to both automaitcally calculate the borders (instead of the naive 10%) as well as use it as a loss function that comprares the edges of two images. This is especially useful in the Emir image where we can see that there is misalignment in the edges of the photo. Using edge detection and automatic cropping, I was able to improve the results:
Before
After
White balancing
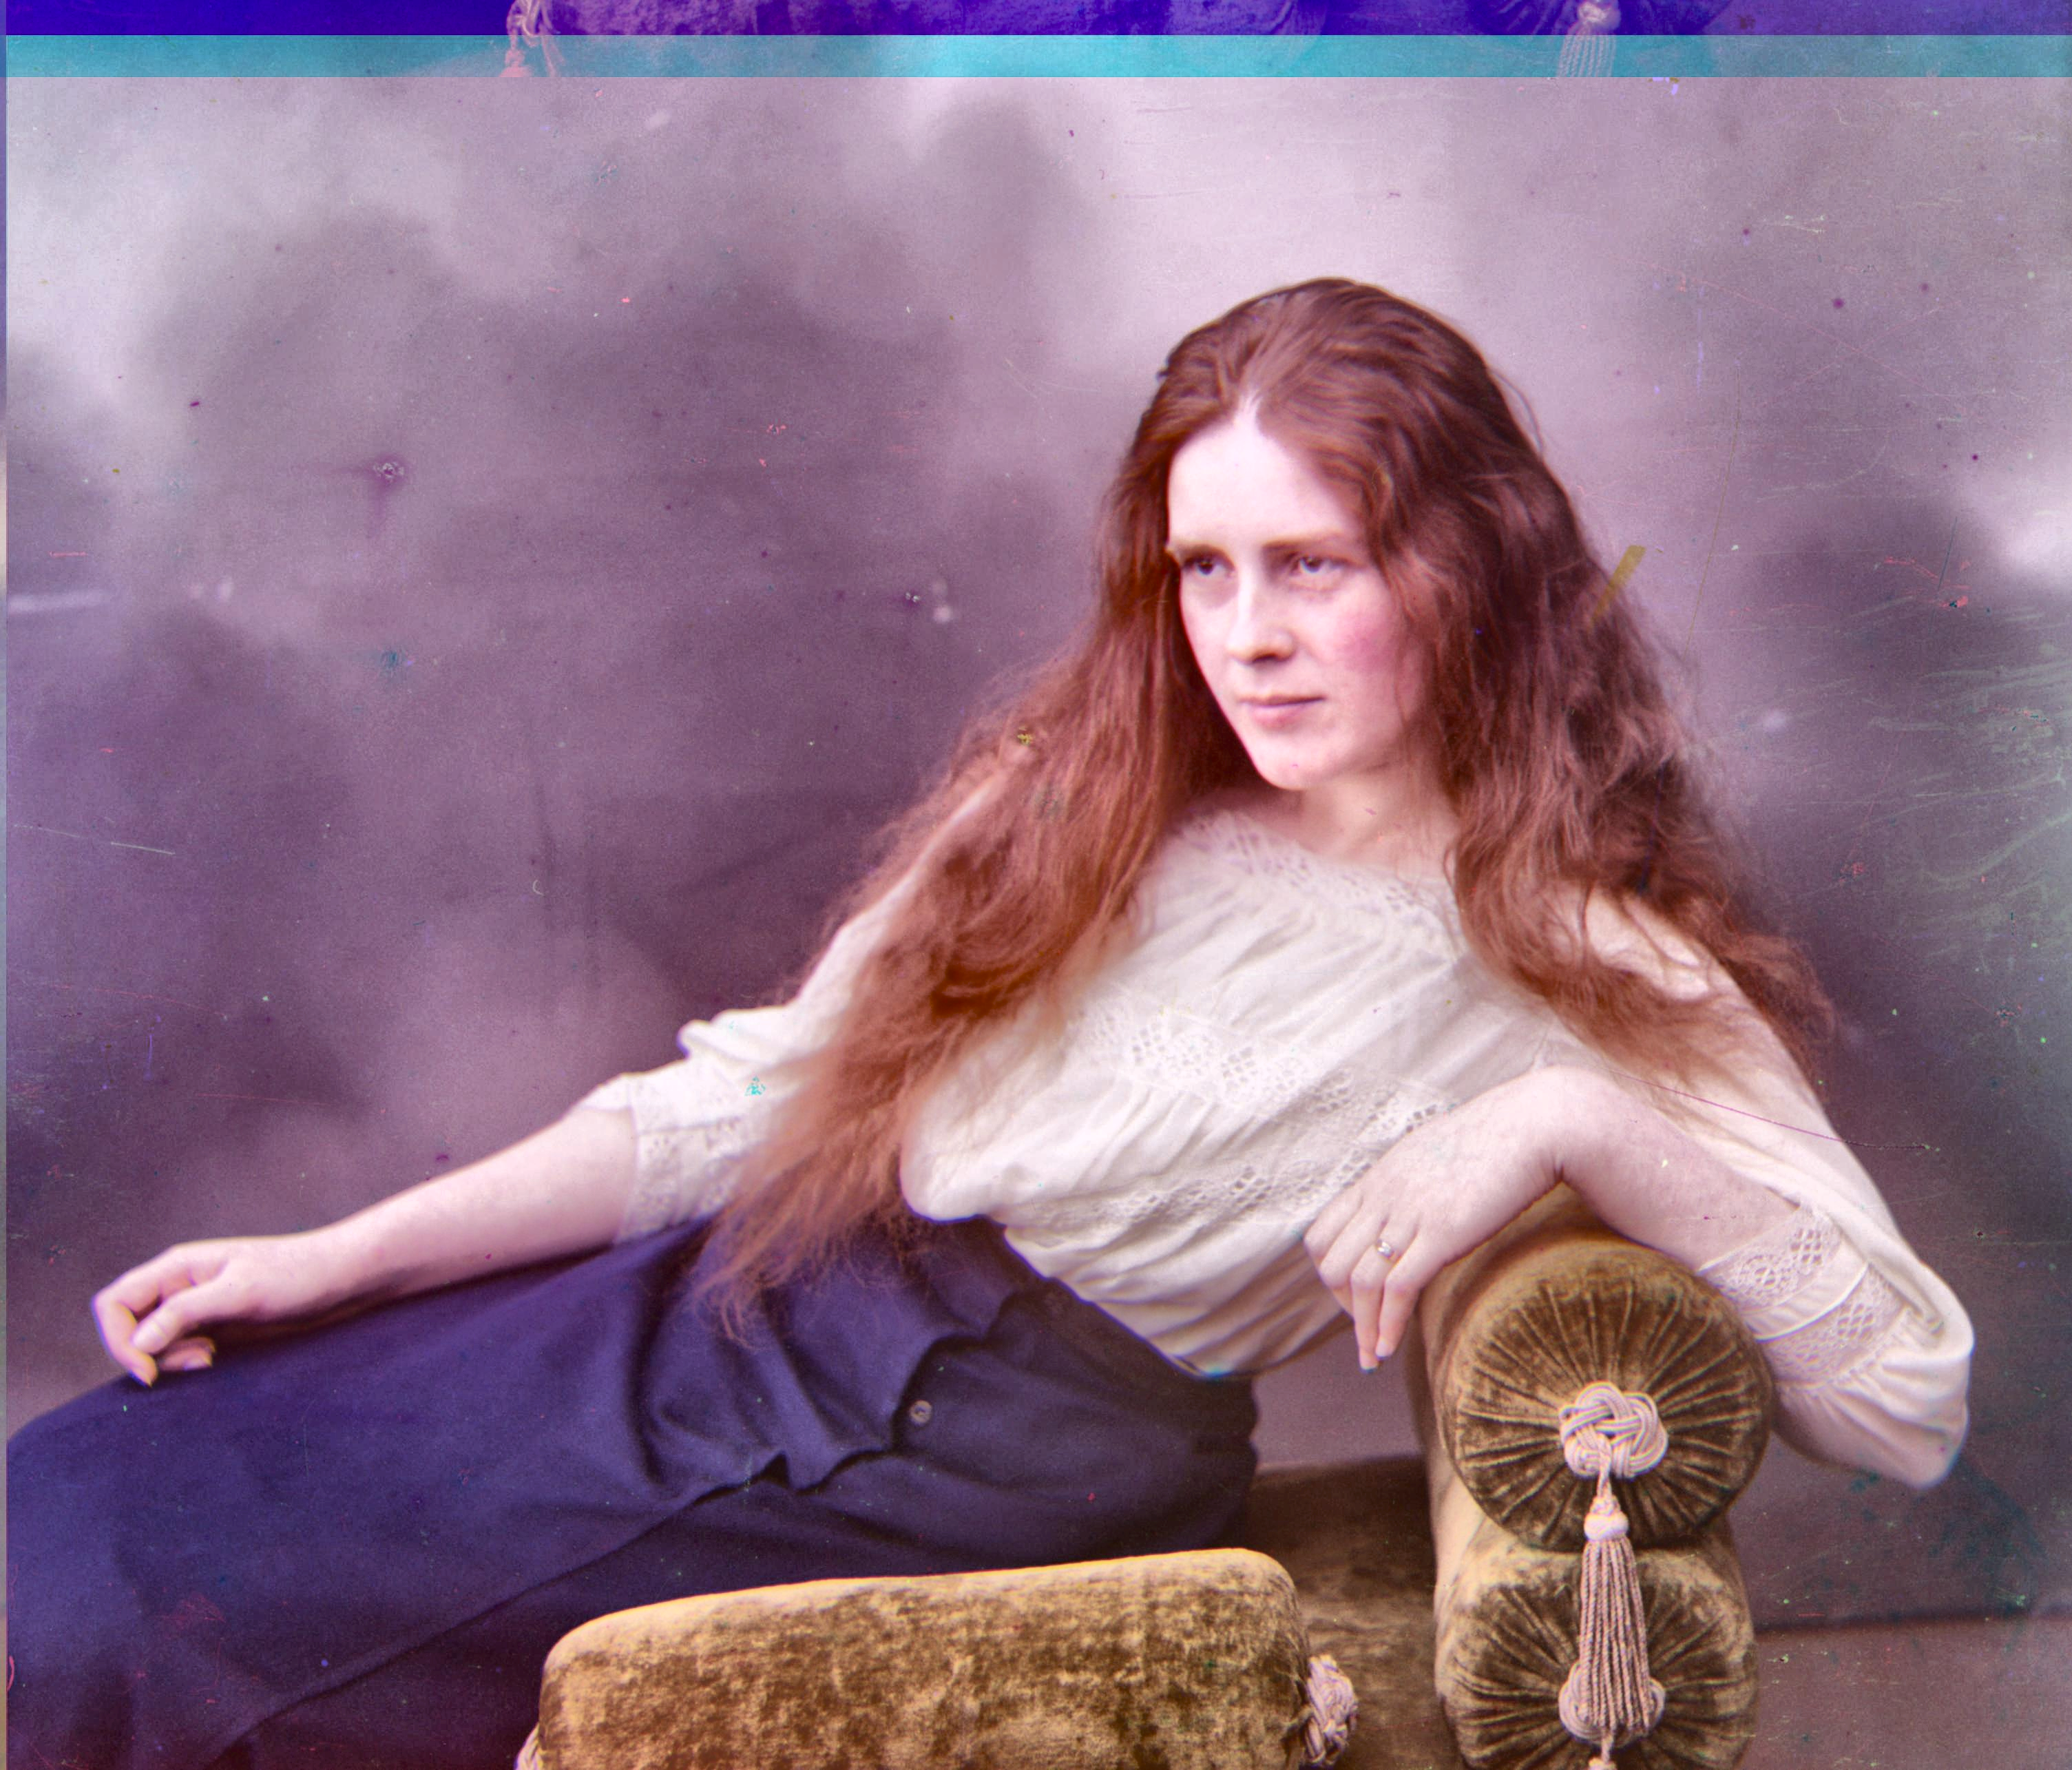
To further enhance the images, I tried implementing white balancing. In my implementation, I used the Gray World Assumption technique, which assumes that the average color of an image should be a neutral gray. The function works by first splitting the image into its red, green, and blue channels. Then, it calculates the average intensity for each channel and the overall average across all channels.
Before
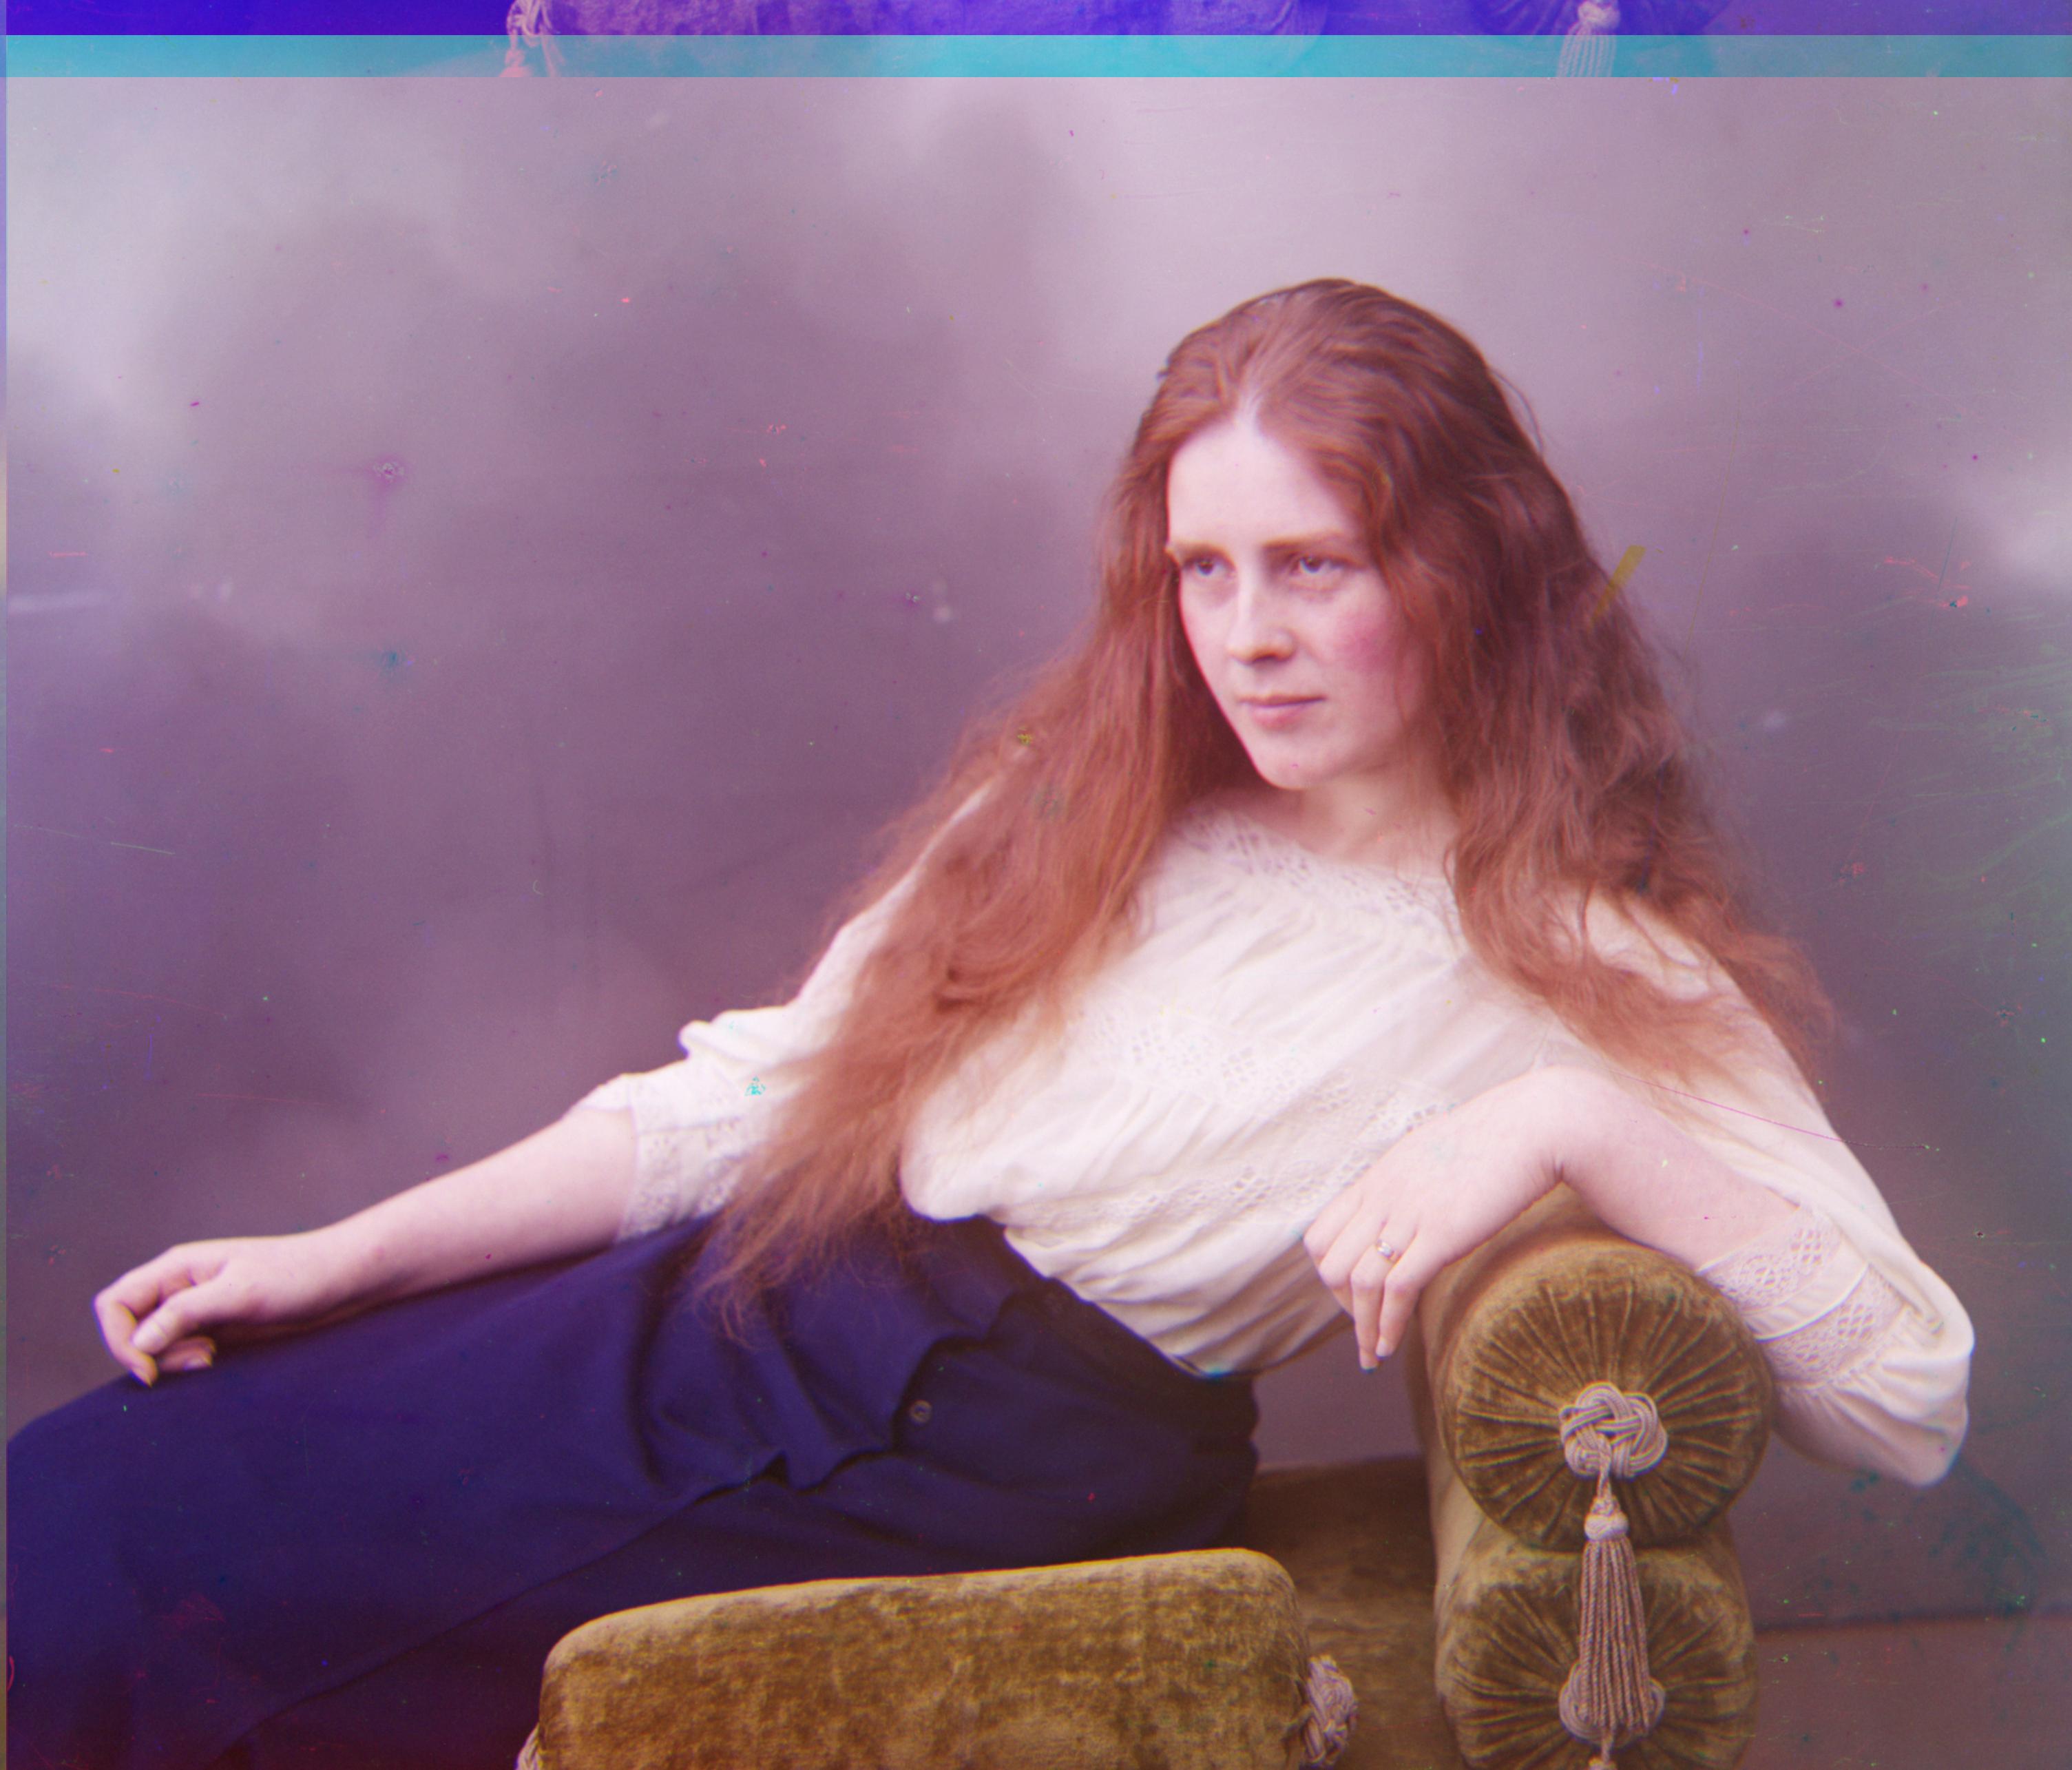
After
Results
Green shift: (49, 24) Red shift: (103, 55)

Green shift: (-3, 2) Red shift: (3, 2)
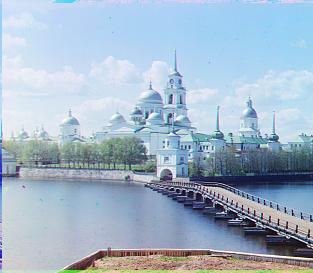
Green shift: (25, 4) Red shift: (58, -4)
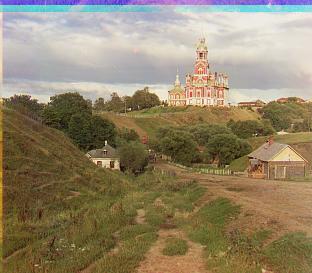
Green shift: (53, 14) Red shift: (112, 11)
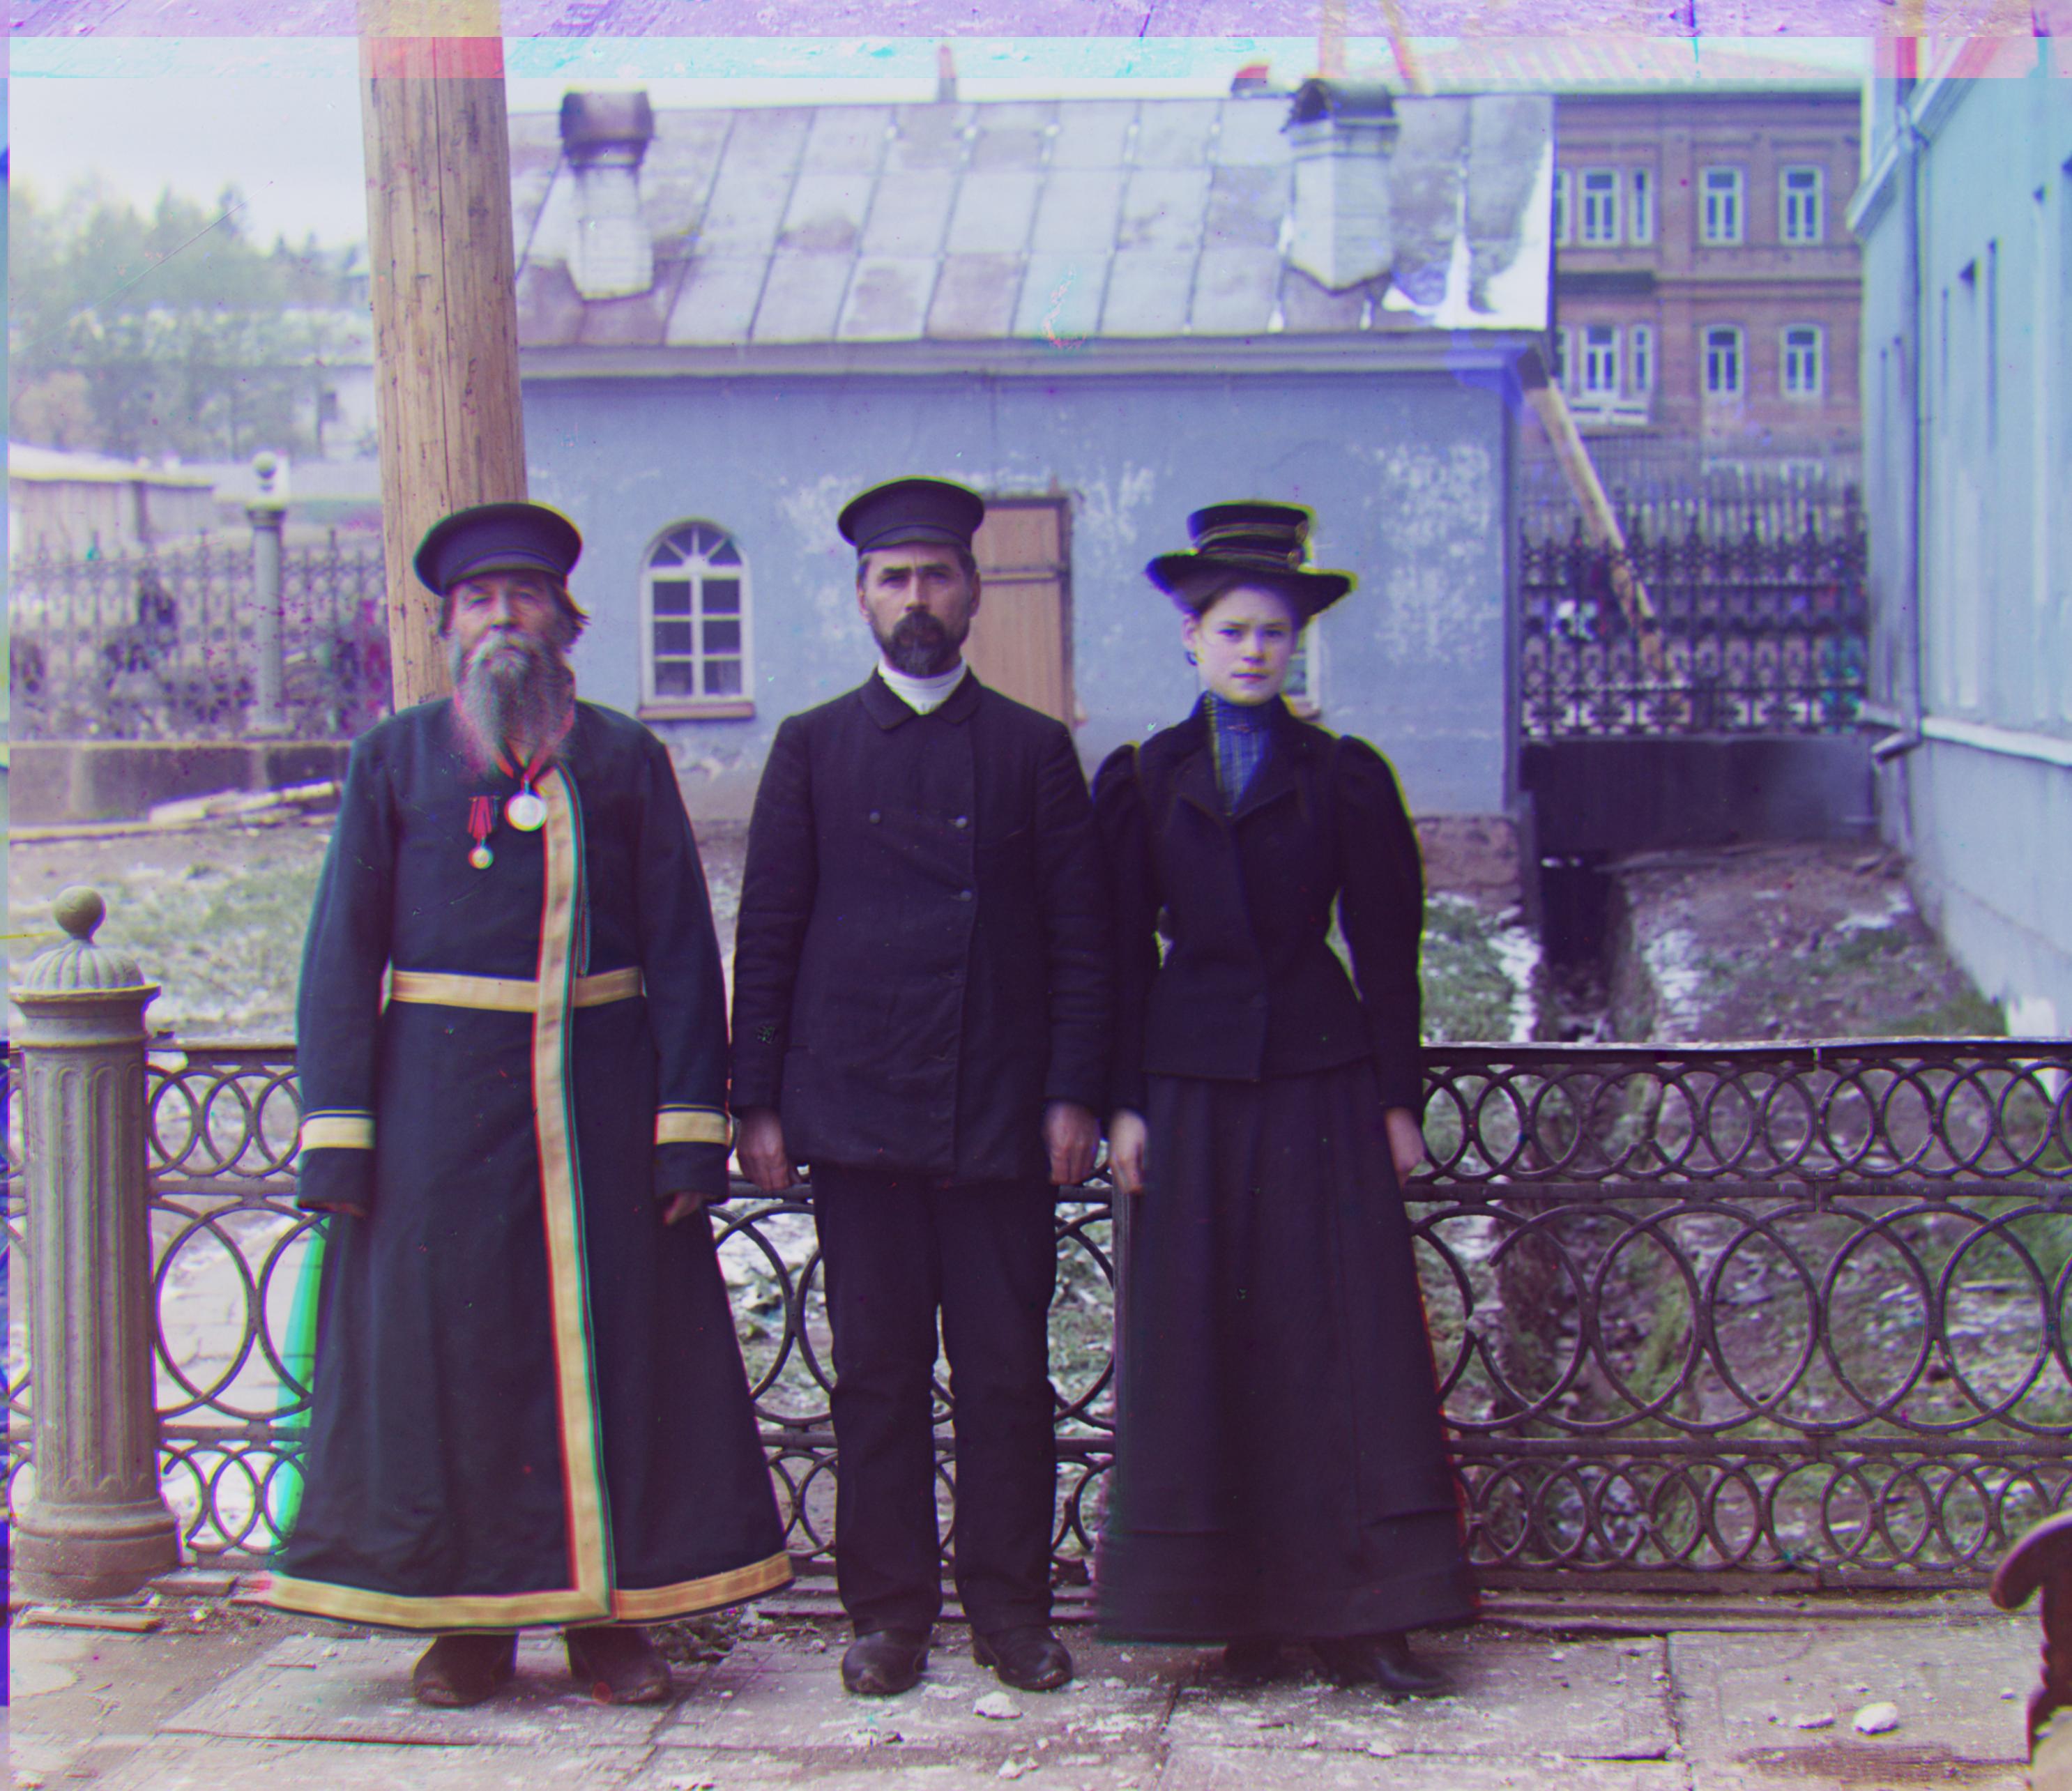
Green shift: (80, 10) Red shift: (176, 12)
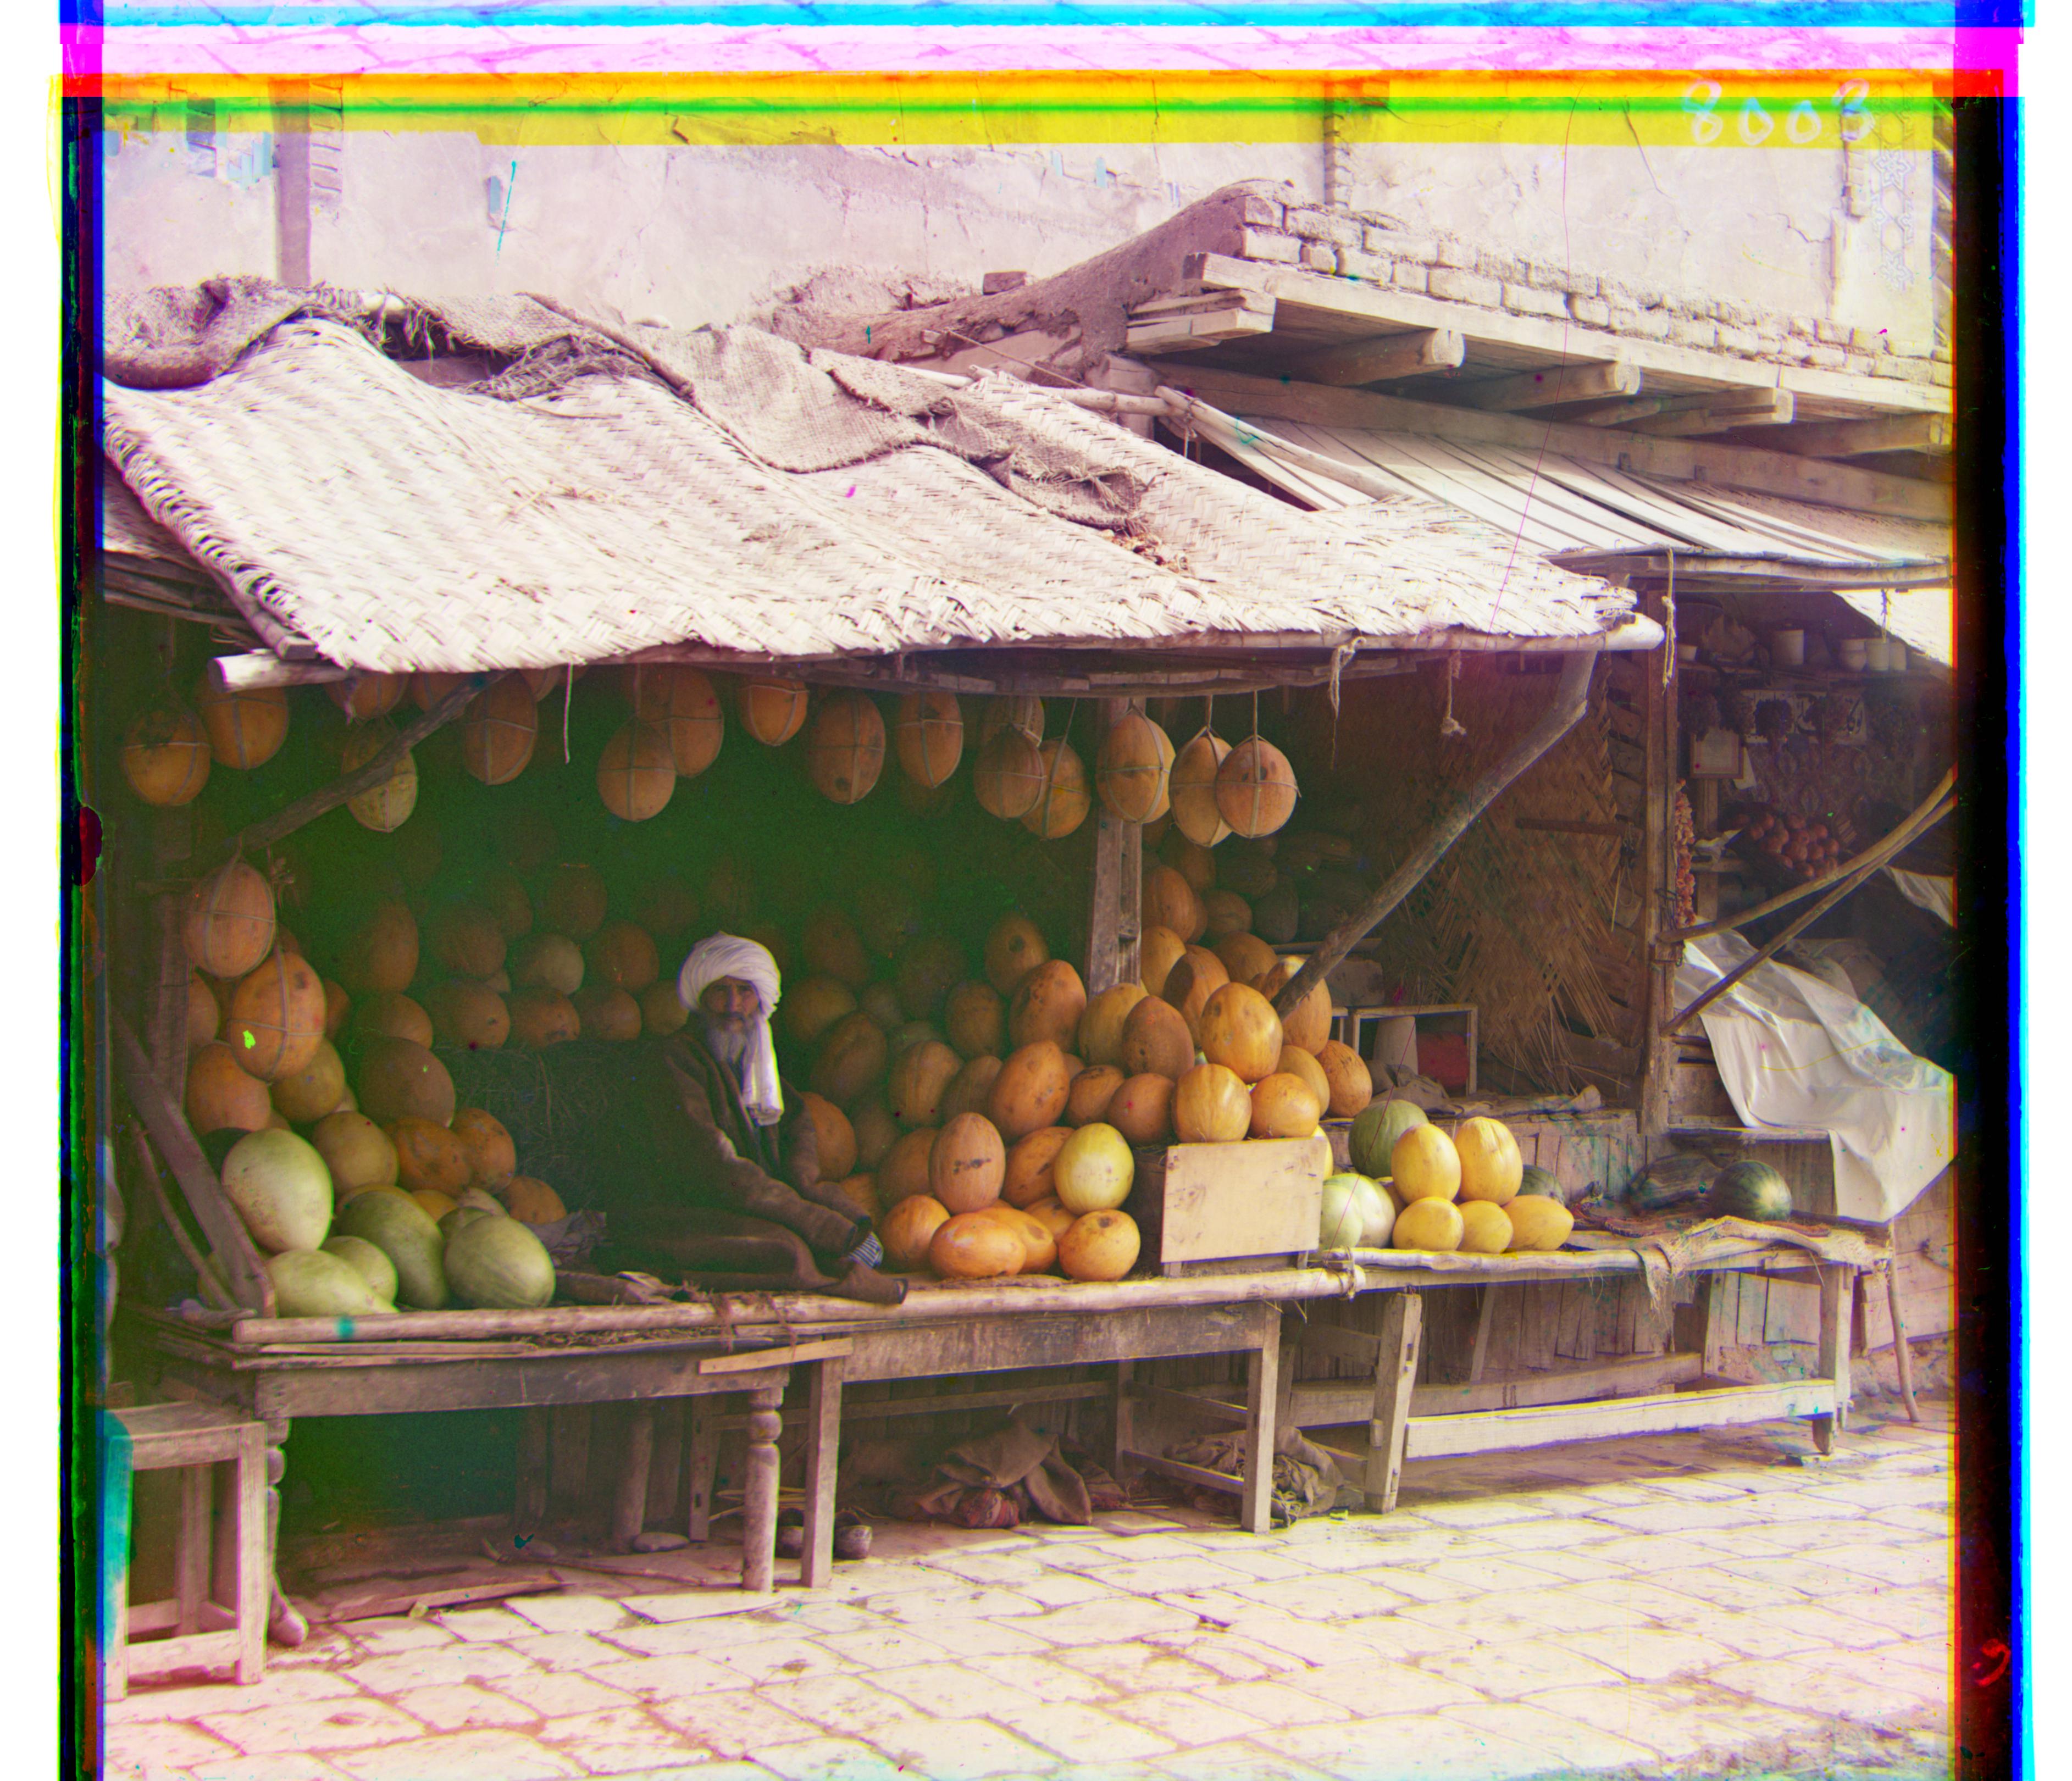
Green shift: (51, 26) Red shift: (108, 36)
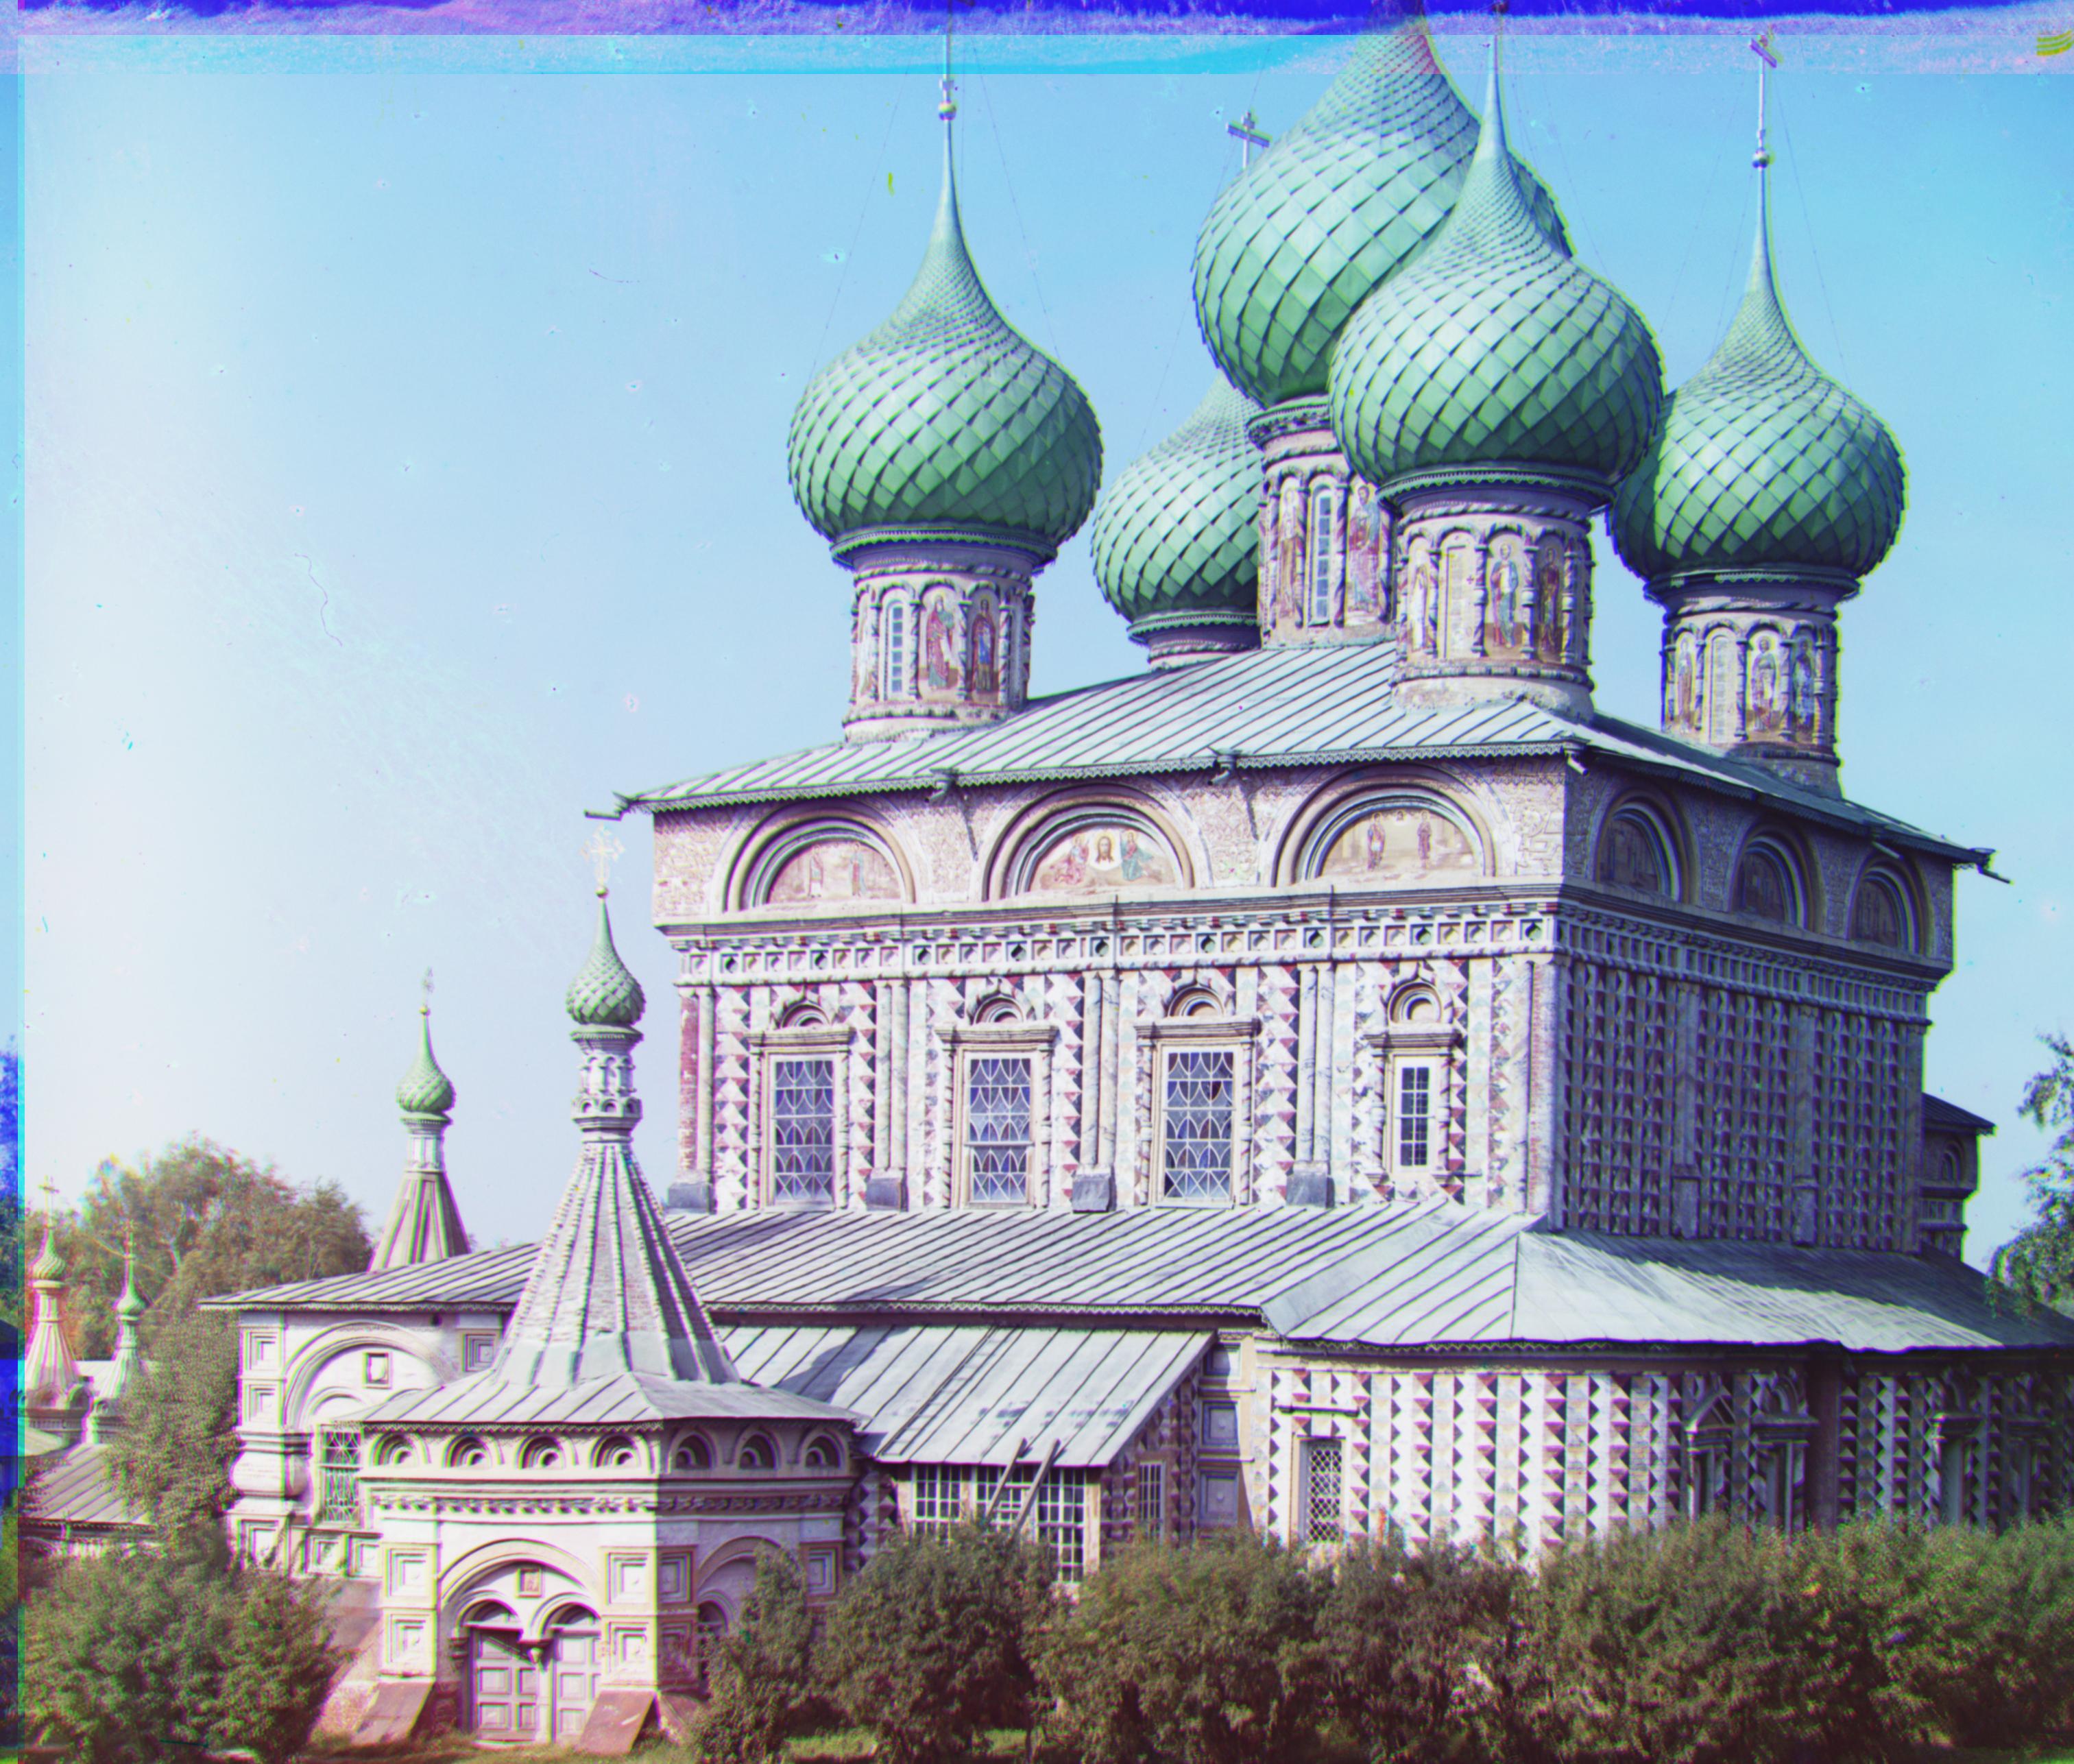
Green shift: (42, 5) Red shift: (87, 32)
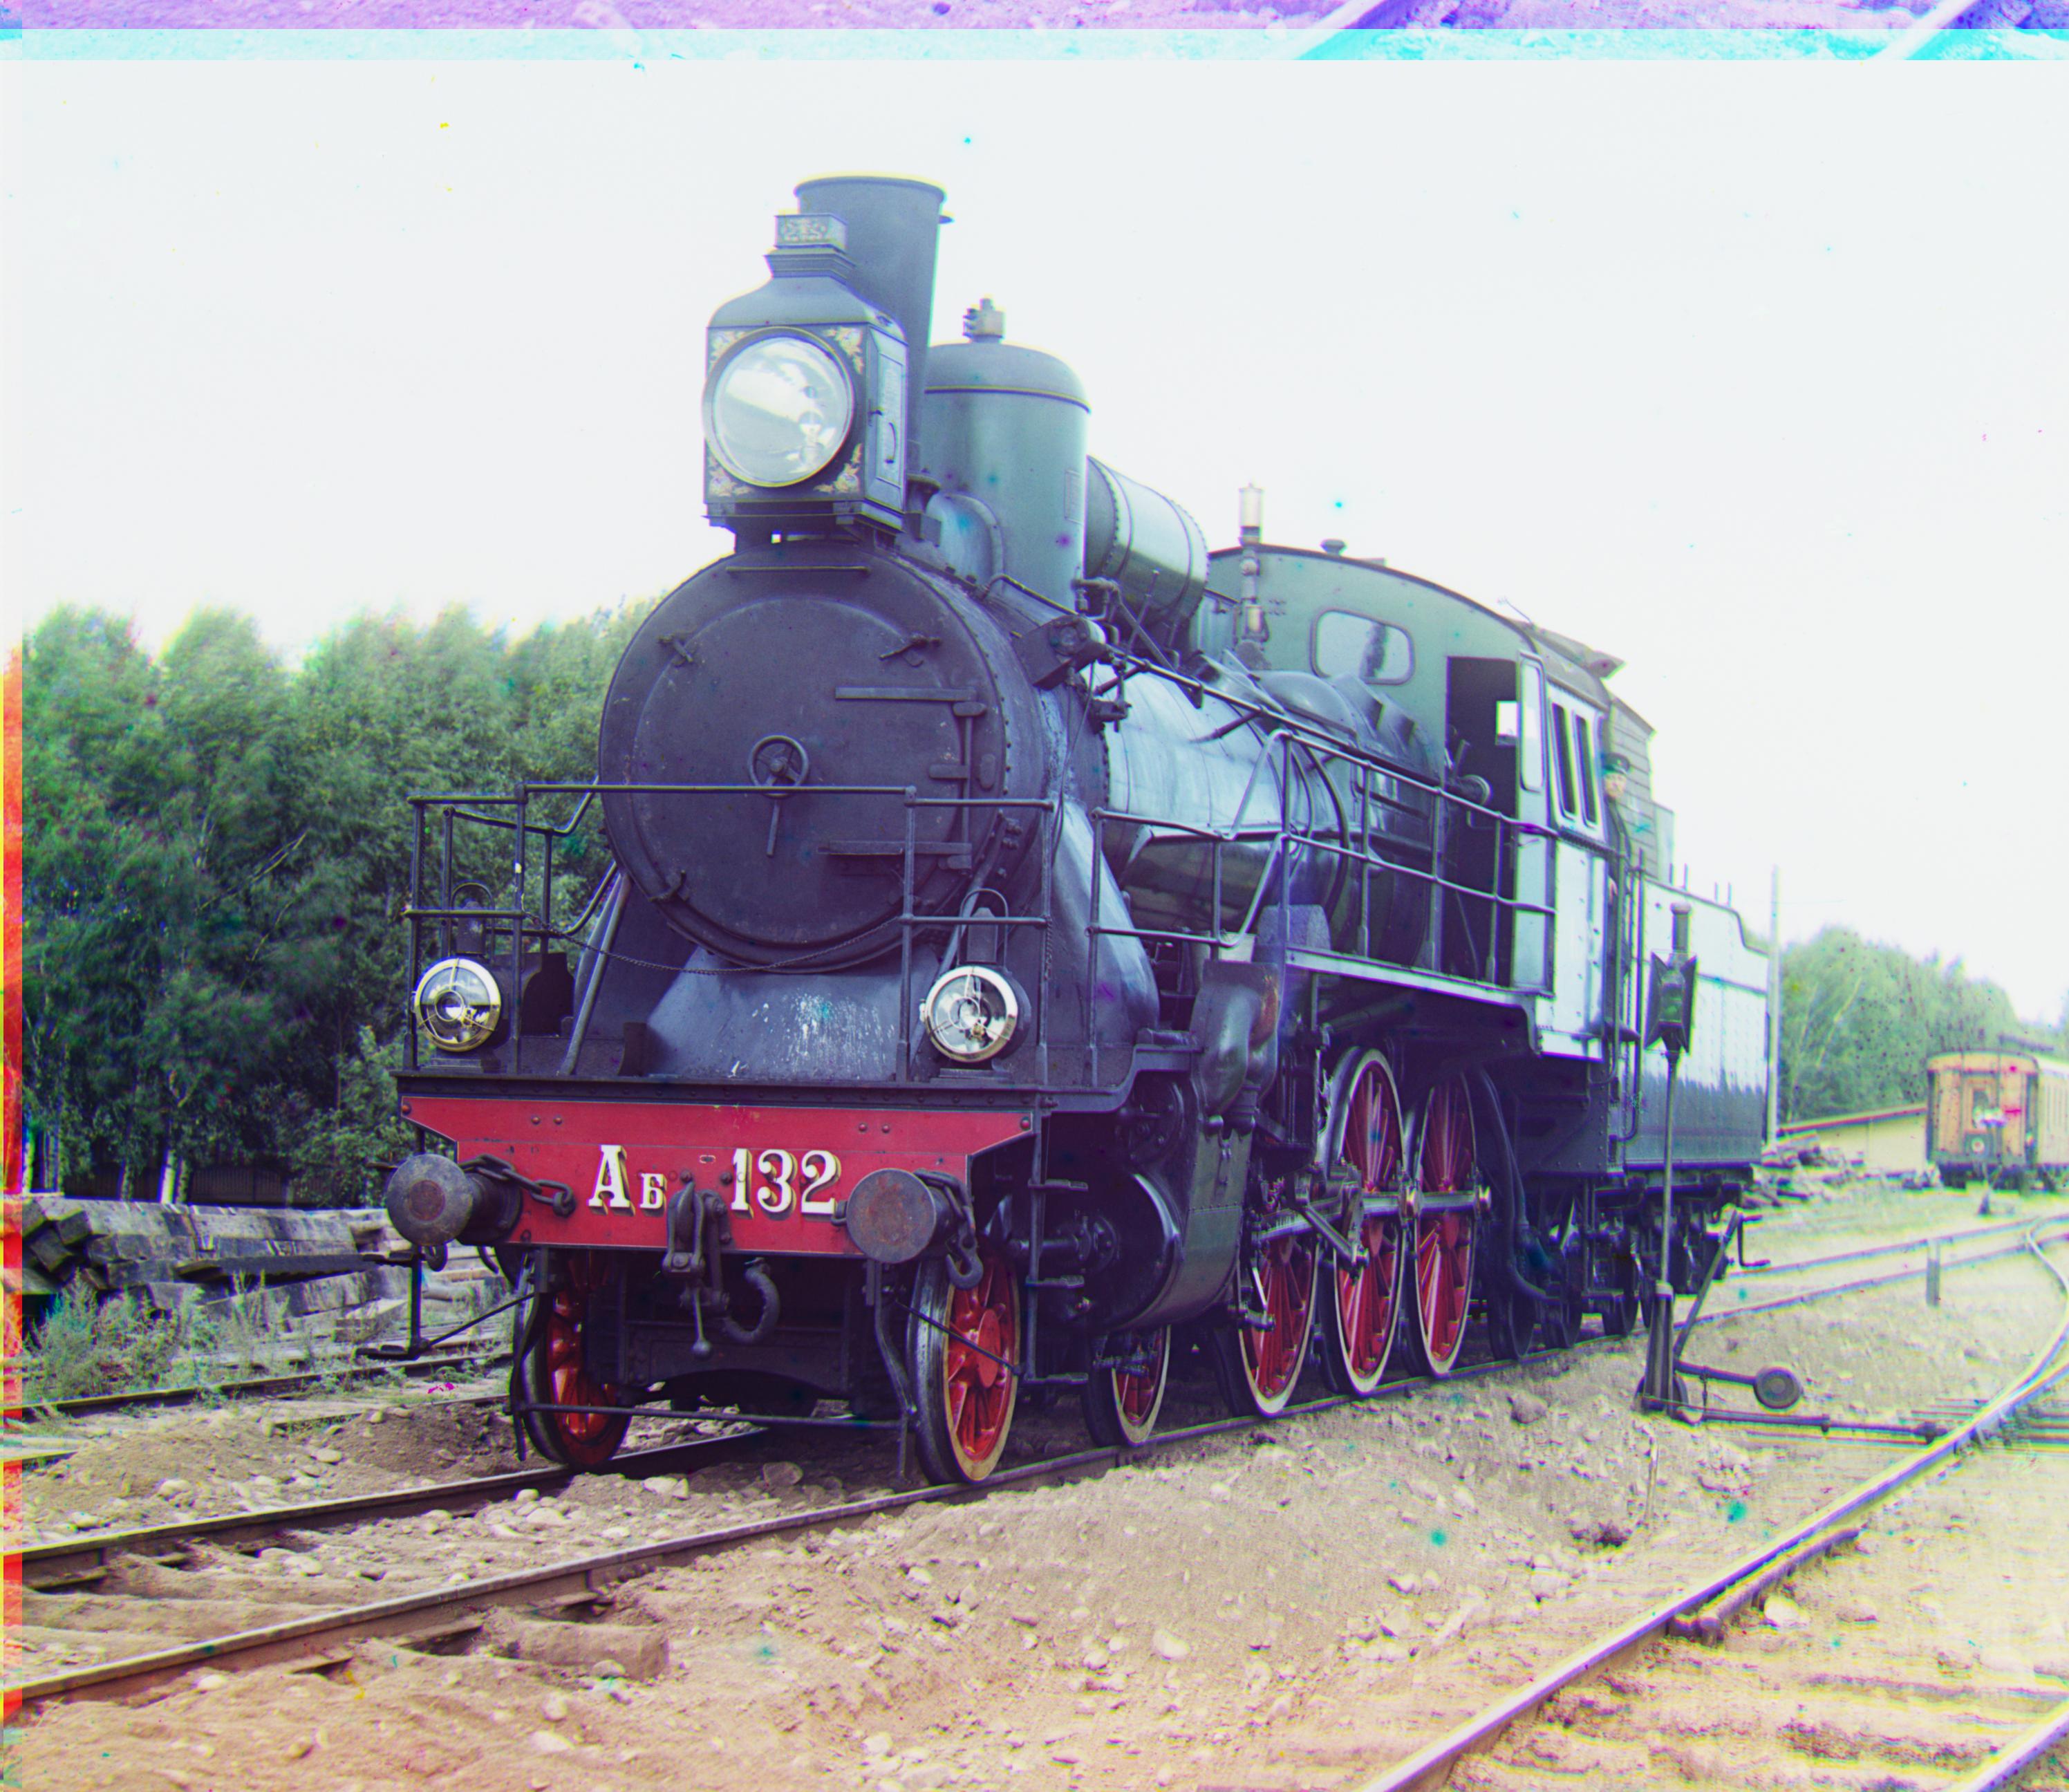
Green shift: (5, 2) Red shift: (12, 3)

Green shift: (3, 3) Red shift: (6, 3)
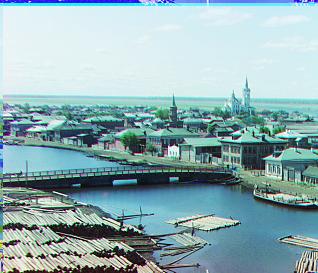
Green shift: (41, 17) Red shift: (89, 23)
Green shift: (80, 30) Red shift: (175, 37)
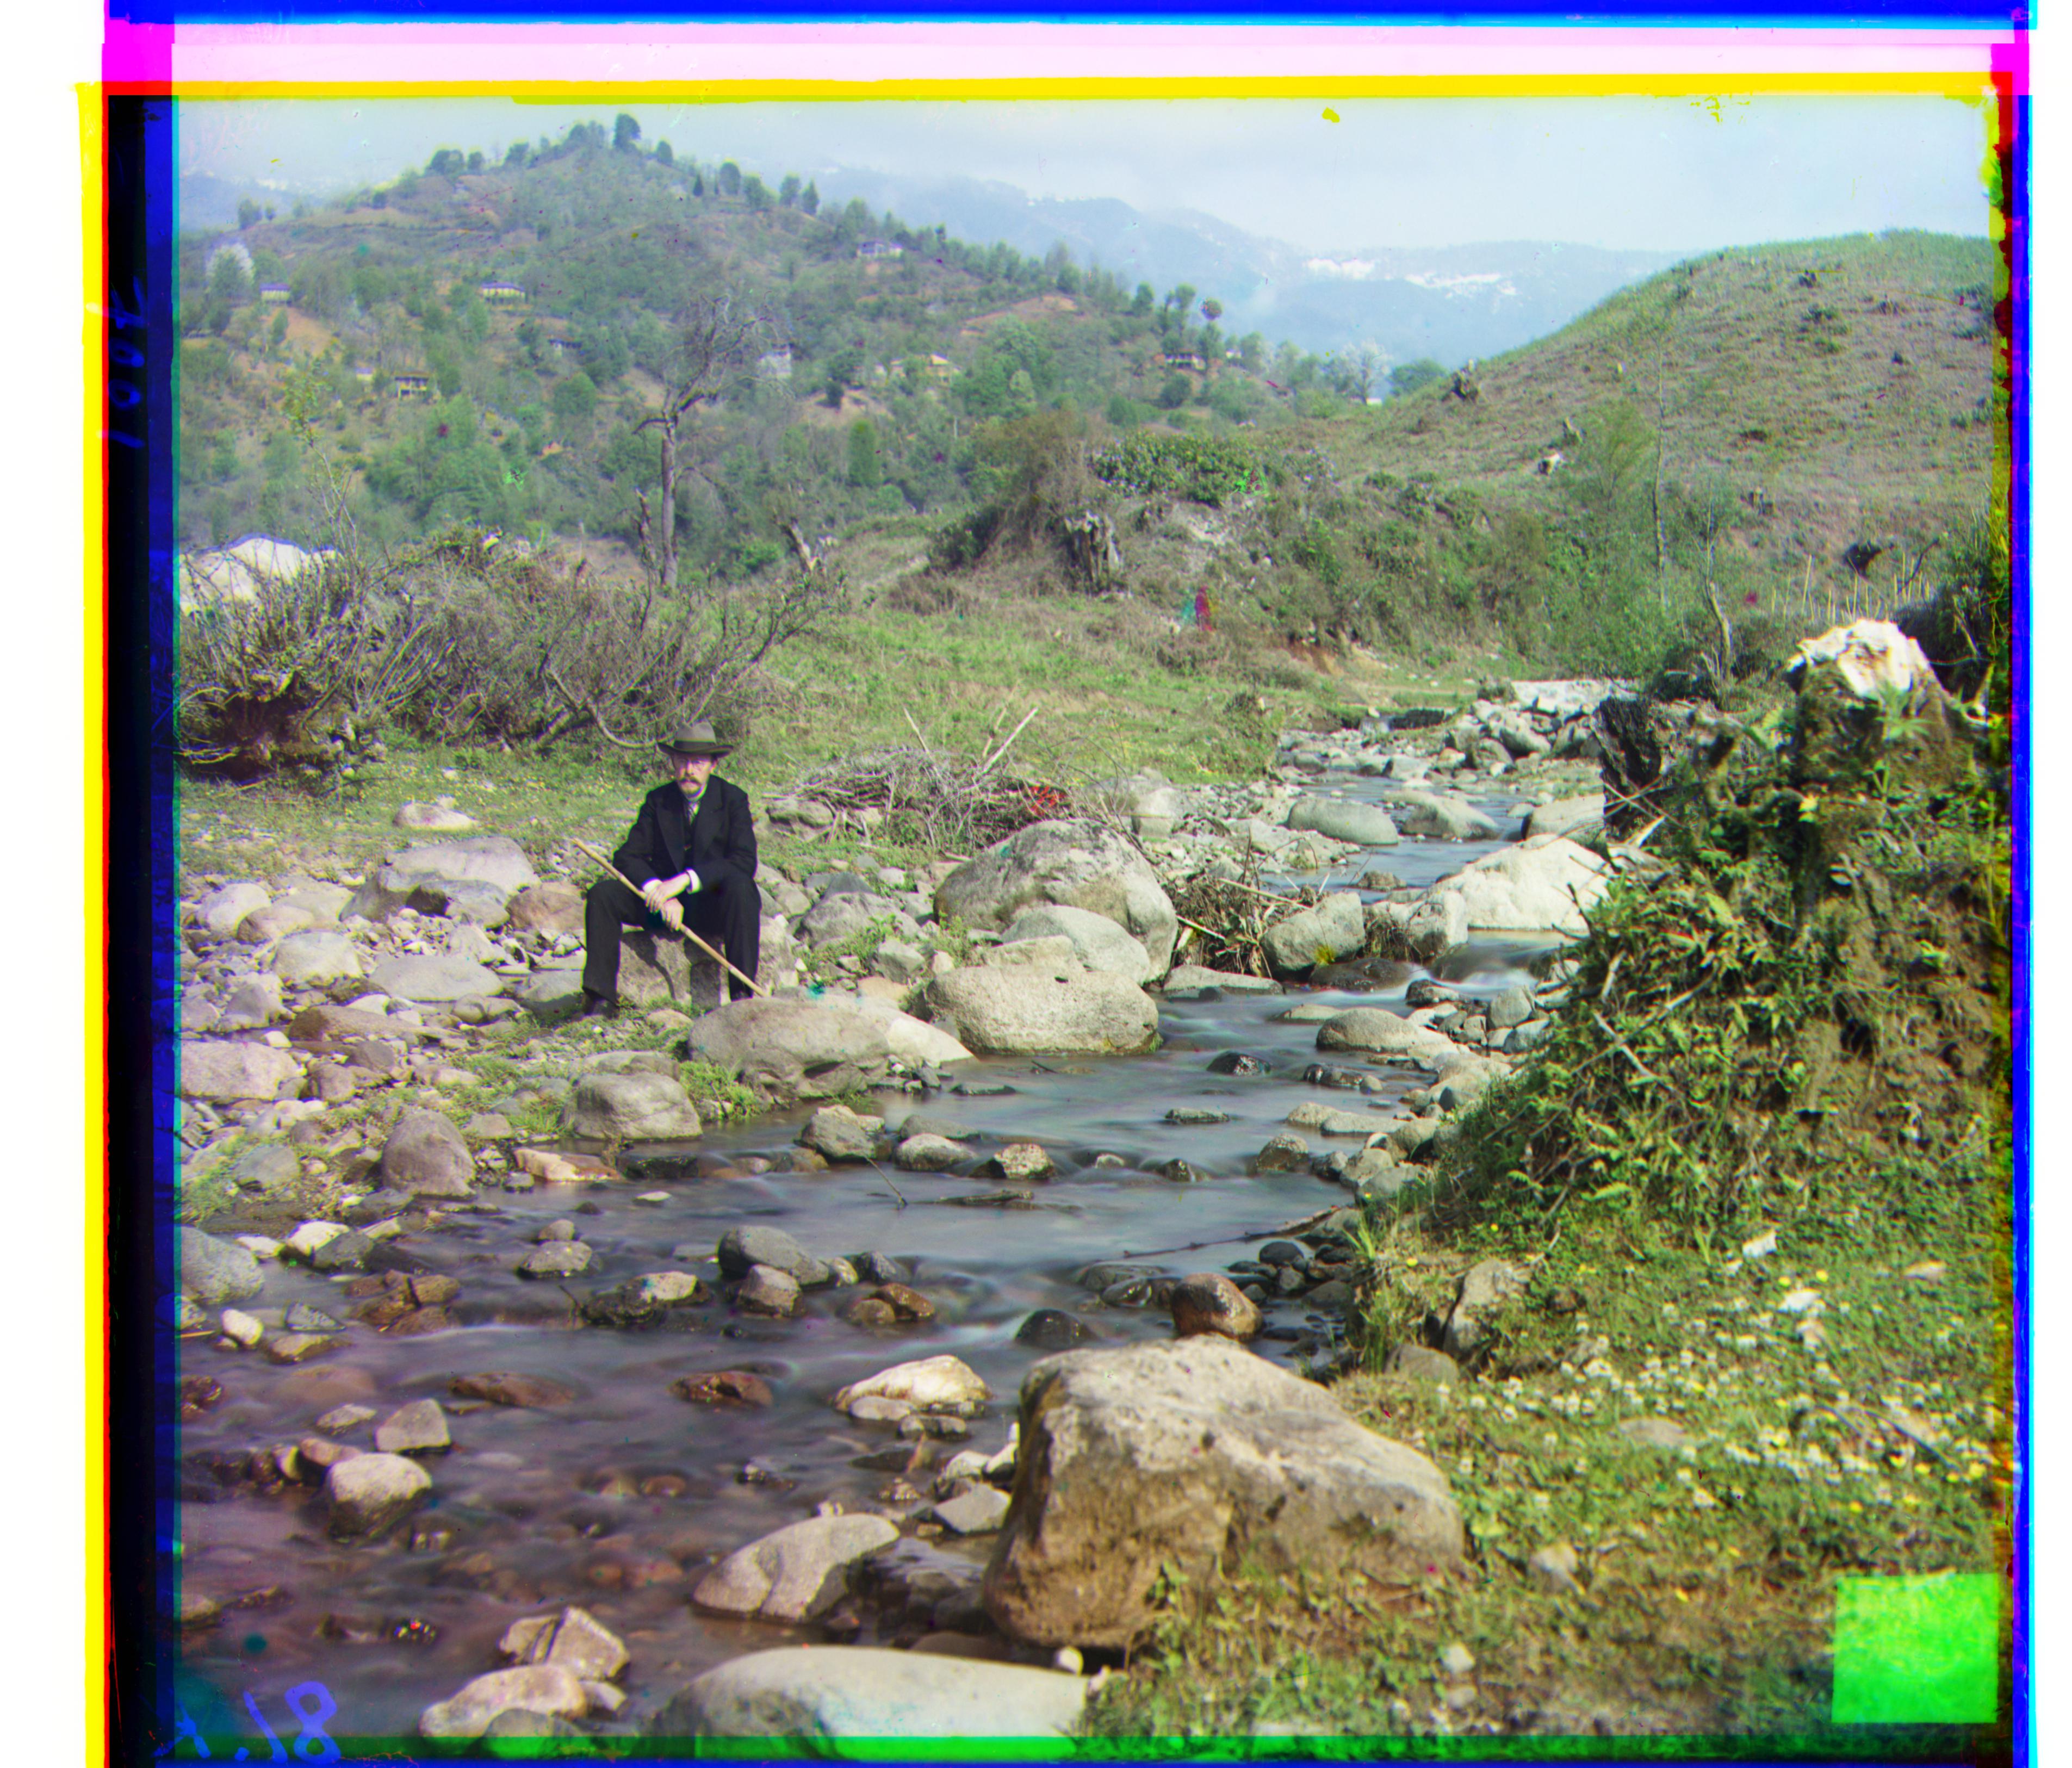
Green shift: (59, 16) Red shift: (124, 13)
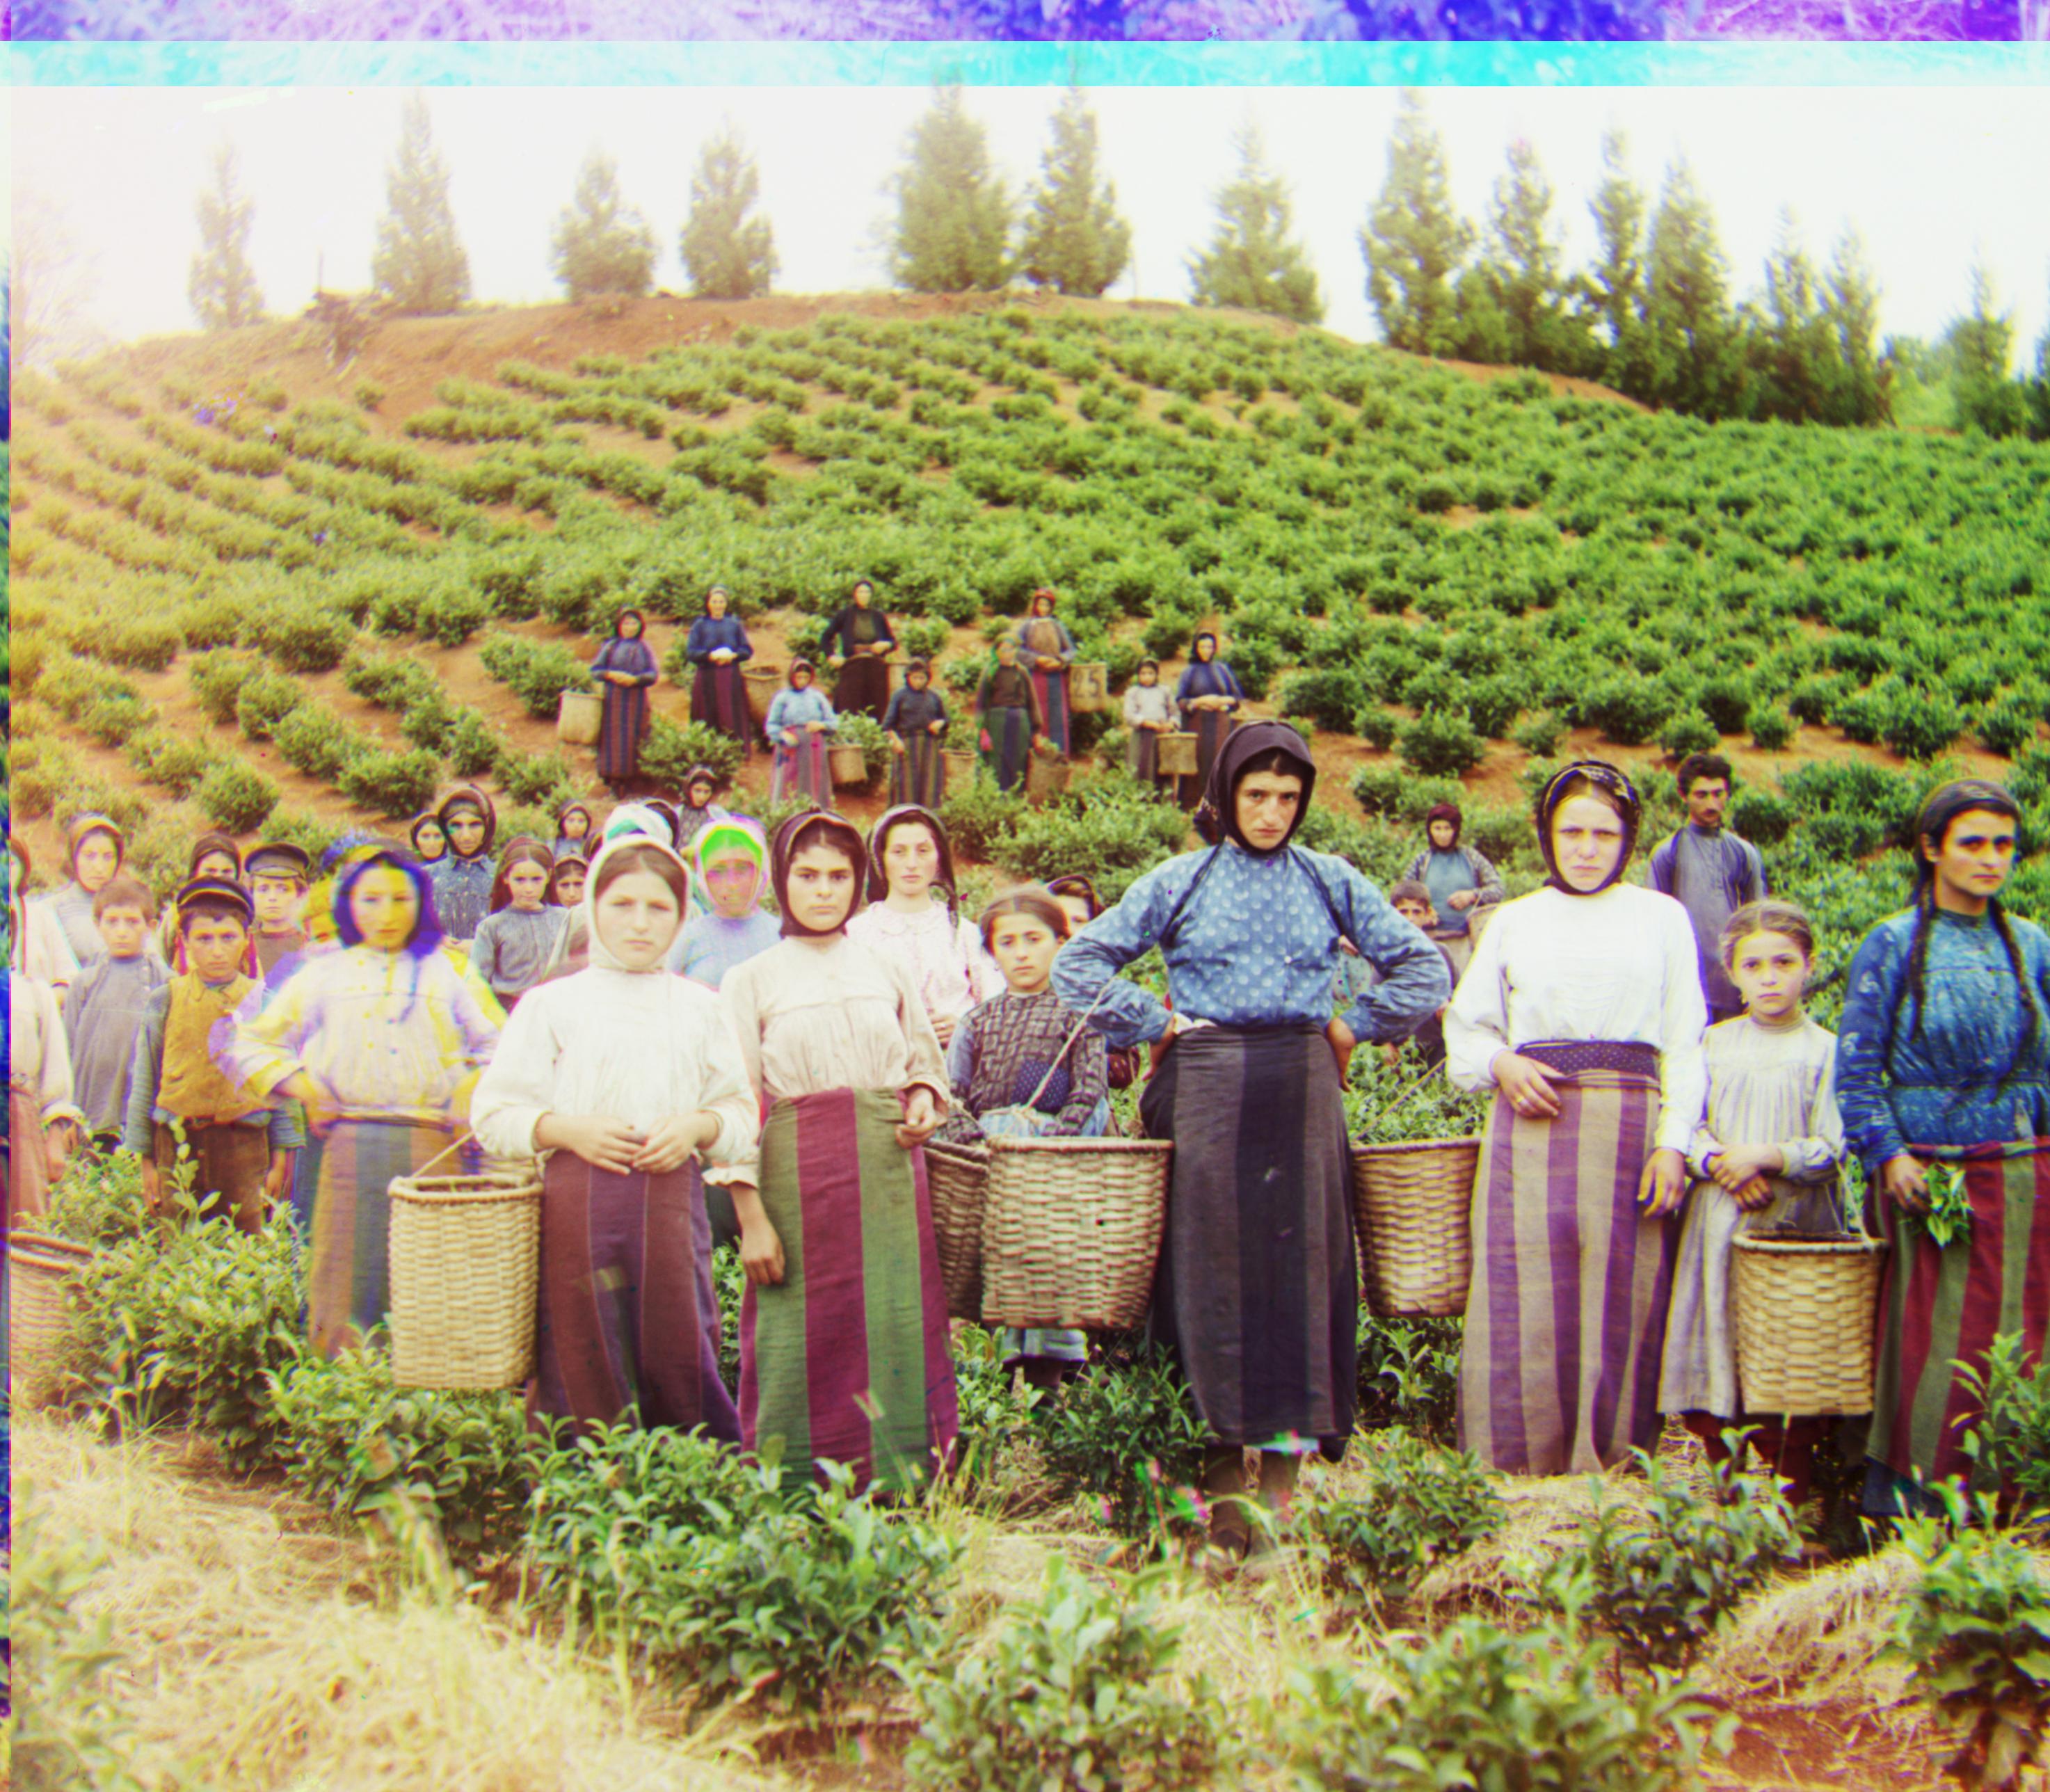
Green shift: (33, -11) Red shift: (140, -27)
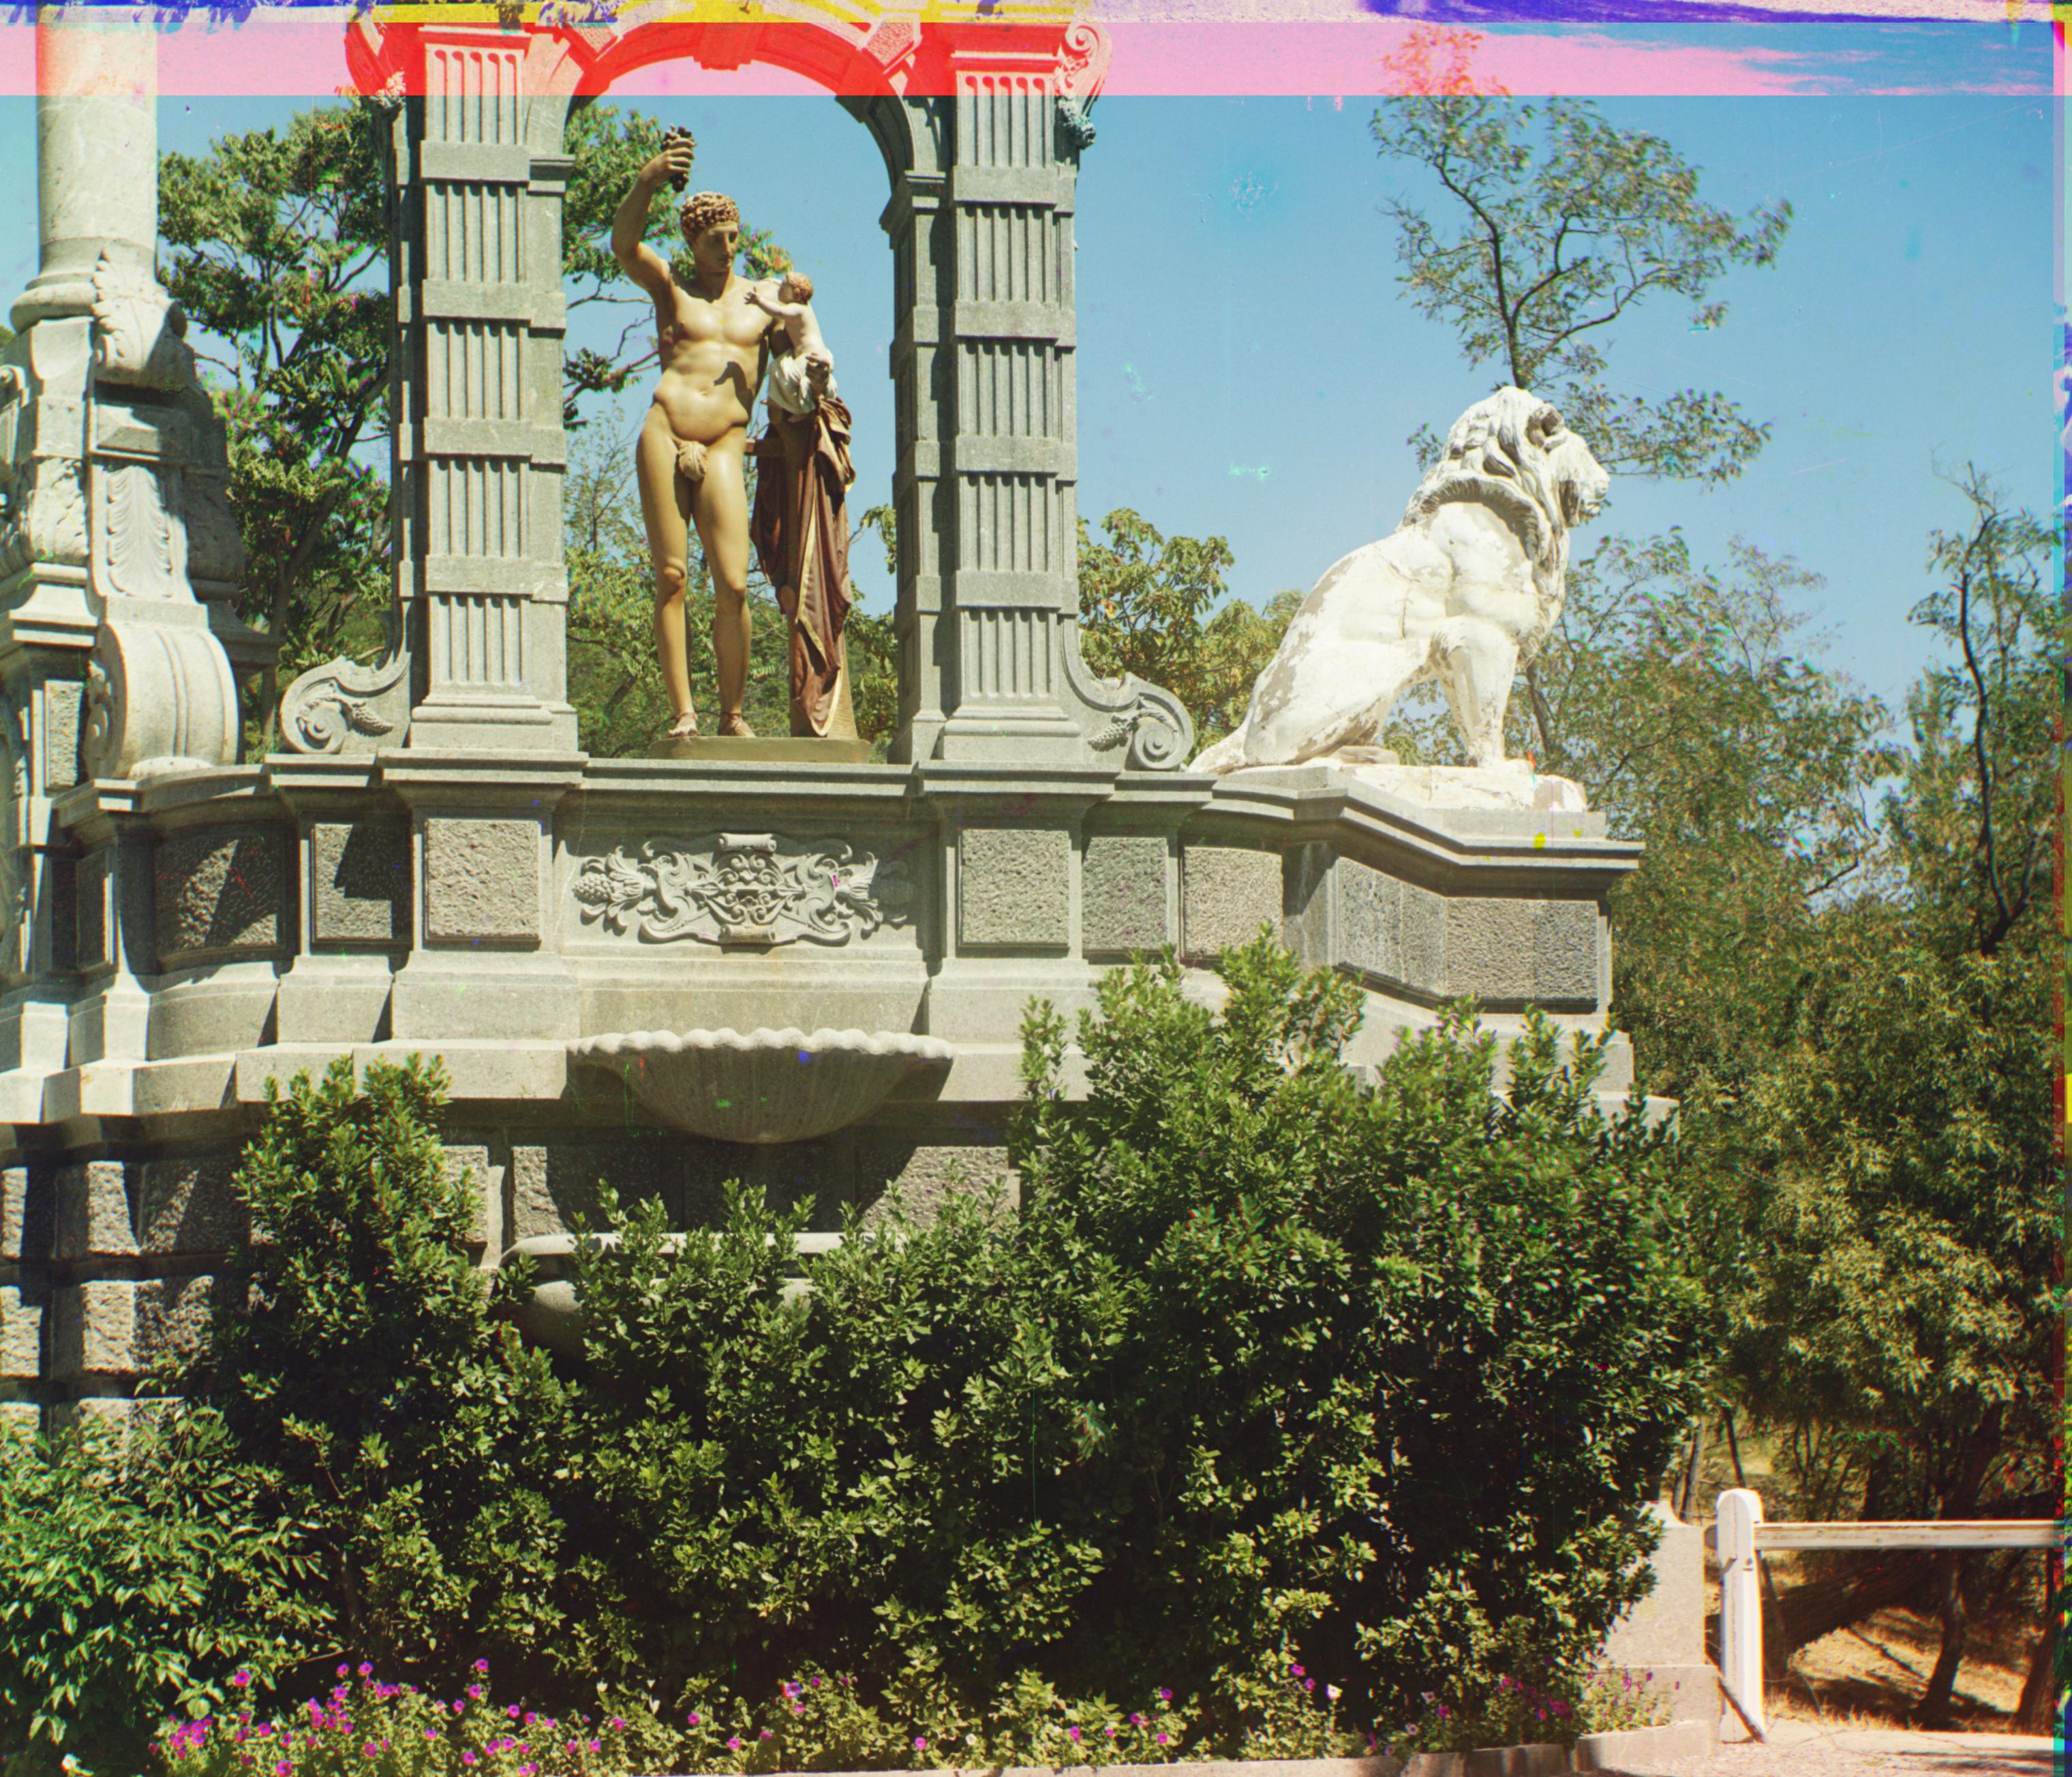
Green shift: (51, 9) Red shift: (112, 11)
